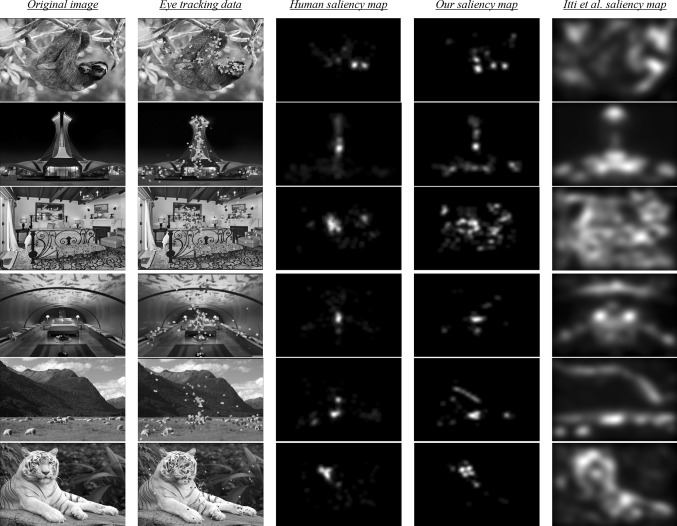
Fig. 13.
A qualitative comparison of the human saliency map, from eye tracking data, with output maps of Itti et al. (1998) model and our model for a variety of test images. From left to right: Original image shown to the subjects. Eye fixation points belonging to 14 viewers in the three blocks of experiment (green, yellow and blue filled circles are corresponding to block 1, block 2 and block 3 respectively). The human saliency map, actual saliency map, computed by convolving a Gaussian filter across the eye fixation points of all subjects in all three blocks (Lighter areas correspond to regions that are more salient). Saliency map as computed by our algorithm. Saliency map as computed by the Itti et al. (1998) algorithm. (Color figure online)

