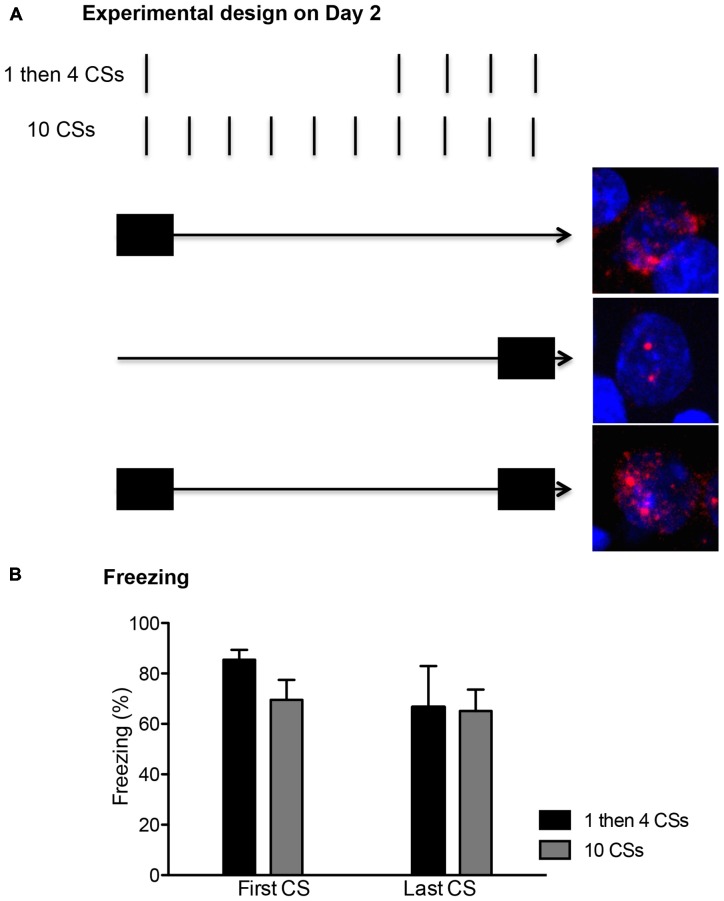
Figure 2.
(A) The conditioned stimulus (CS) presentations were arranged temporally to correlate with the peaks for cytoplasm and nuclear expression of Arc mRNA. The first CS presentation in both groups occurred within the first 5 min (depicted with a filled rectangle). This allowed for about 25 min wait period since the initial Arc induction, showing peak cytoplasmic expression (shown as the red perinuclear staining around the blue DAPI+ cell in the top picture). The last CS presentation in both groups occurred within the last 5 min before the rats were killed, thus matching the peak nuclear Arc expression (shown as two red foci inside of DAPI+ cell in the middle picture). A cell with Arc induction at both time points should show both nuclear and perinuclear staining as seen in the bottom picture. (B) Freezing levels were comparable between the first and last CS presentations and also between the two groups (n = 6 for each group).

