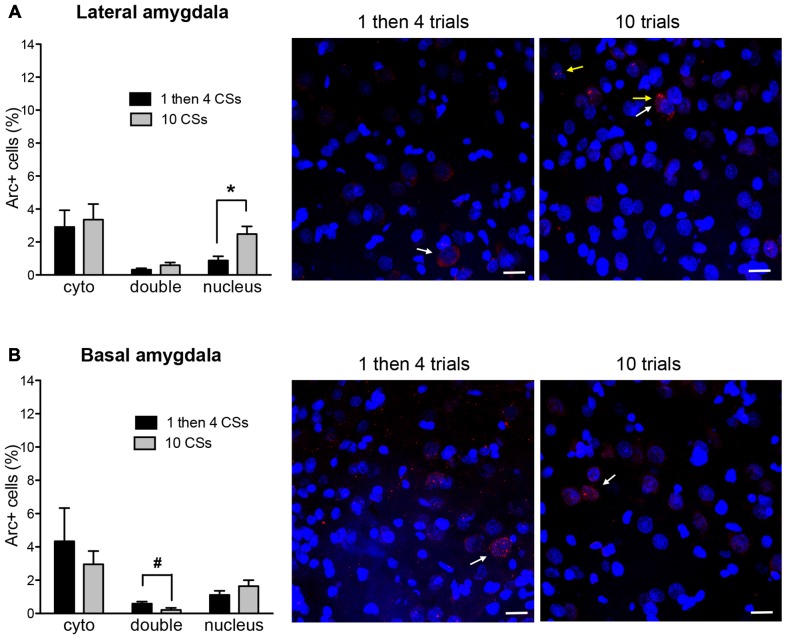
Figure 4.
The bar graphs show percentage of DAPI+ cells expressing Arc mRNA in the cytoplasm (cyto), nucleus, or both (double) in lateral nucleus (A) and basal nucleus (B) of the amygdala. The photomicrographs are maximum intensity projections of representative z-stacks from the sampled regions in the amygdala. DAPI+ cells are shown in blue and Arc mRNA are shown in red. The yellow arrows point to Arc foci in the nuclei and the white arrows point to the Arc in the perinuclear areas (cytoplasm). Scale bar = 20 μm. *p < 0.05, #p = 0.054.

