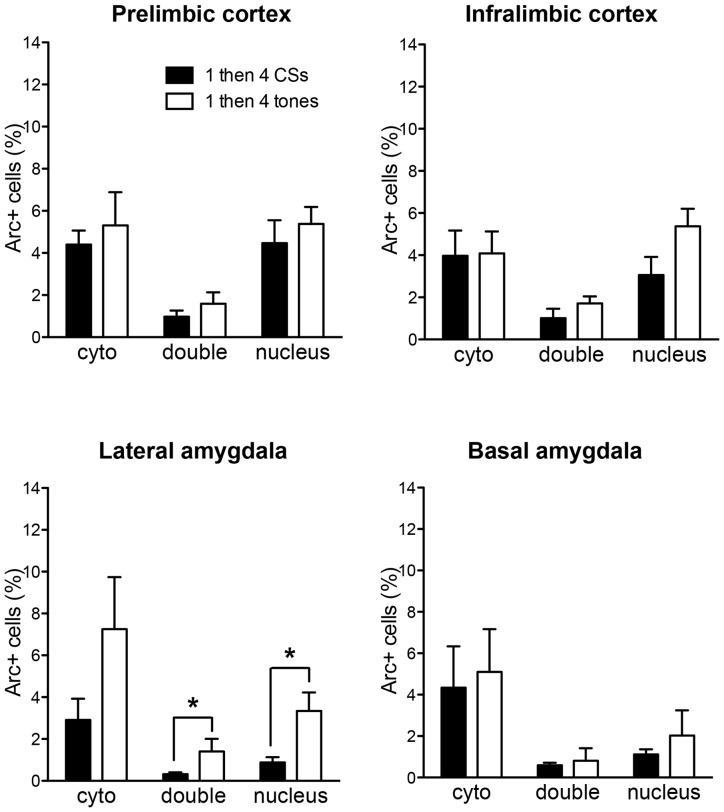
Figure 5.
The bar graphs show percentage of DAPI+ cells expressing Arc mRNA in the cytoplasm (cyto), nucleus, or both (double) of the 1 then 4 CSs group (n = 6) shown in Figures 2, 3 and the non-fear conditioned control group (1 then 4 tones, n = 3) that received identical CS presentations. *p < 0.05.

