
FIGURE 5.
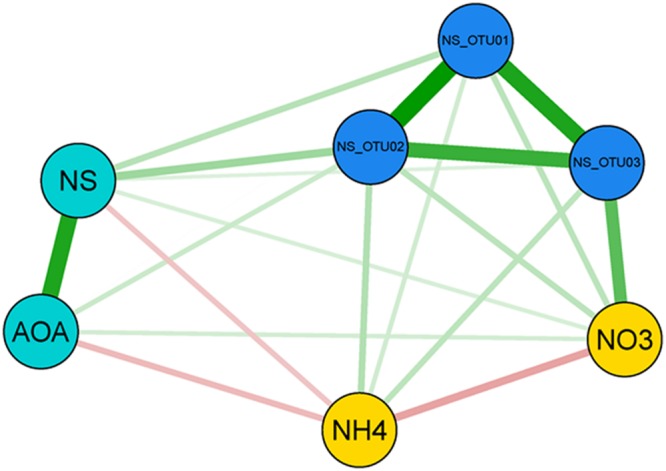
Network analysis of interactions between NS-assigned OTUs, gene abundances and nitrification-associated nitrogen-pools in October. Depicted are Pearson correlations between three parameter groups for sampling date October: gene abundances (light blue circles), Nitrospira OTUs 01-03 (dark blue circles) and nitrate and ammonium concentrations (yellow circles), respectively. Edges between the nodes are weighted according to the correlation strength. Positive coefficients are colored in green, negatives are displayed in red. AOA, Ammonia-oxidizing archaea; NS, Nitrospira-like nitrite-oxidizing bacteria (NOB).