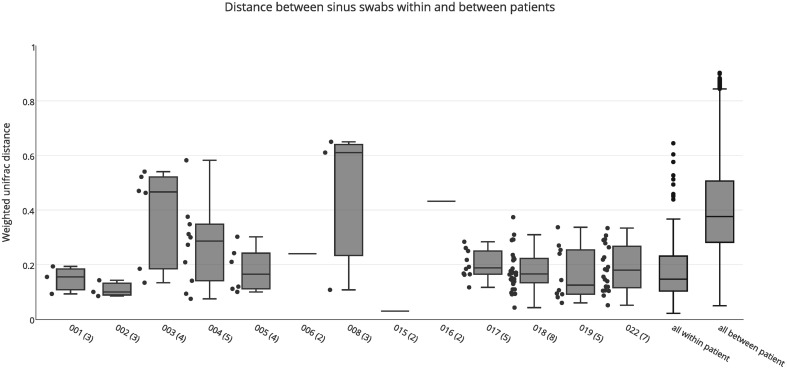
Figure 1.
Weighted unifrac distances between individual swab samples for each patient, as well as all intra-individual (all within patient) and inter-individual (all between patient) distances. The number of samples for each patient is shown in brackets next to the patient ID. Boxes represent second and third quartiles; whiskers represent 1.5 times the interquartile range, and all individual data points are shown beside the boxes (where more than one data point is available per patient), except for the all within and all between patient groups.

