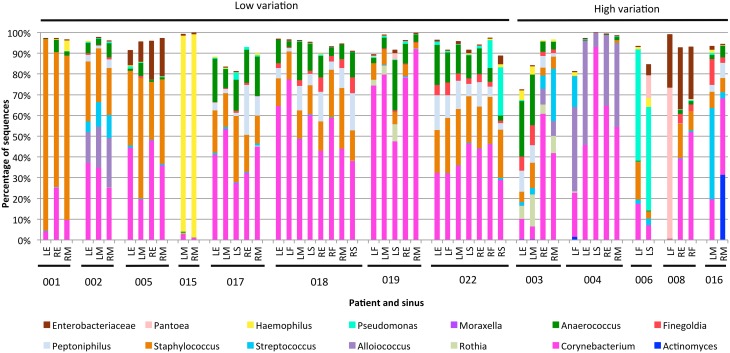
Figure 2.
Bar plots showing bacterial communities from individual sinus swabs of patients with low (<0.2) or high (>0.2) median between-sinus weighted unifrac distances. Sinus locations are indicated by LE (left ethmoid), LF (left frontal), LM (left maxillary), LS (left sphenoid), RE (right ethmoid), RF (right frontal), RM (right maxillary), and RS (right sphenoid), with patient numbers indicated below. Only bacterial genera which represented at least 5% sequences in at least one sample were included.

