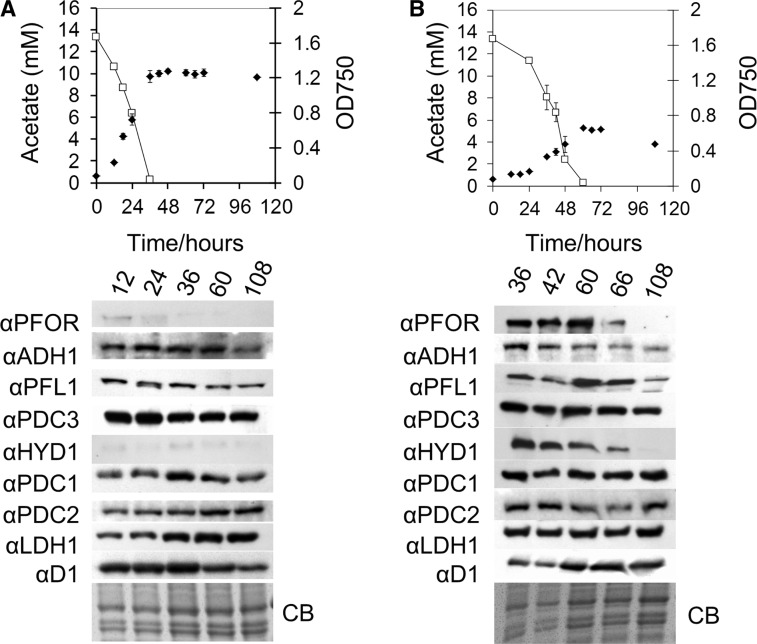
Fig. 5.
Analysis of fermentative enzyme expression during growth in acetate-containing medium. Cultures were grown in the light (A) or dark (B). Samples were taken from early log to late stationary phase at the indicated times. Top panels: line graphs comparing growth as estimated by OD750 (filled diamonds) against acetate concentration (open squares), error bars are provided ± SD of three biological replicates. Bottom panels: immunoblot analysis comparing abundance of fermentative enzyme expression over time; approximately 8 × 10⁵ cells were loaded per lane. Cultures were inoculated from mid-log phase TAP-grown cultures under continuous illumination. Protein loading is indicated by the Coomassie Brilliant Blue (CB)-stained gel.

