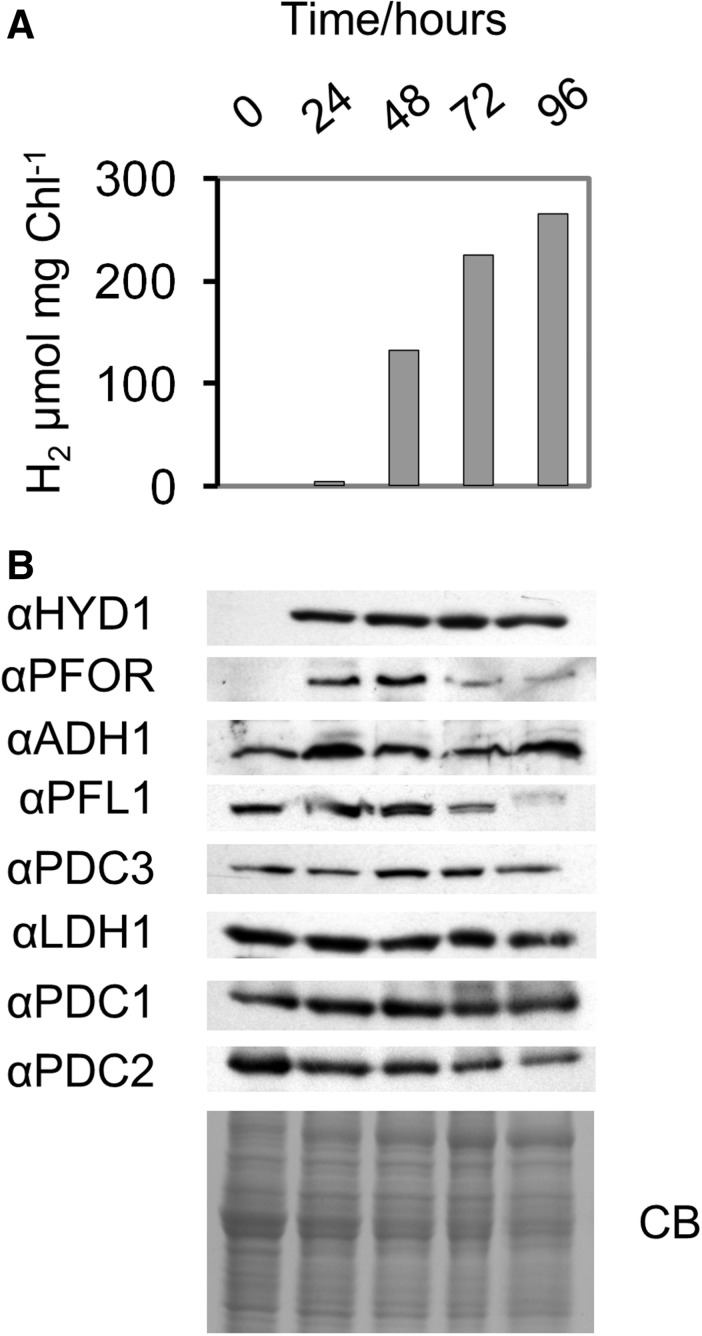
Fig. 7.
Analysis of fermentative enzyme expression during sulfur deprivation in the light. (A) H2 evolution measured by gas chromatography. (B) Immunoblot analysis with 8 × 10⁵ cells loaded per lane and protein loading assessed by Coomassie Brilliant Blue (CB). The zero time point was taken immediately prior to sulfur deprivation to avoid induction of hydrogenase.

