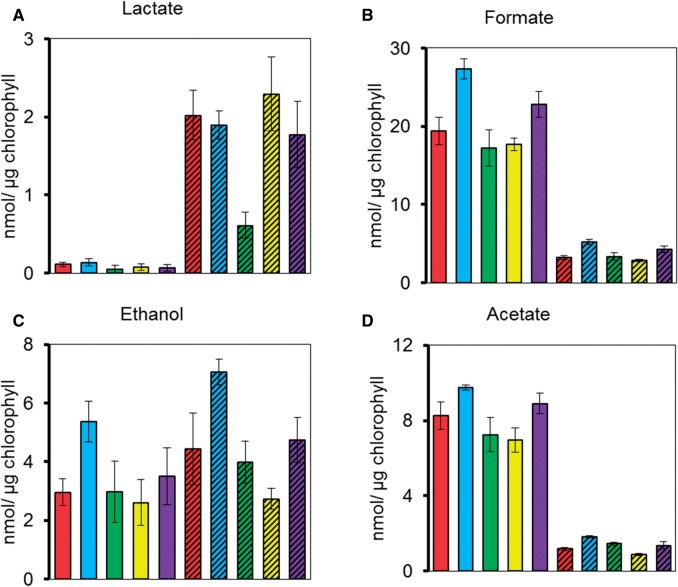
Fig. 8.
NMR analysis of excreted metabolites after 4 h of dark anaerobic incubation in high salt medium (HSM). Represented are CC-124 (red bars), ldh1-KD1 (blue bars), ldh1-KD2 (green bars), ldh1-KD3 (yellow bars) and ldh1-KD4 (purple bars). To inhibit PFL1, 10 mM sodium hypophosphite was added into the cultures (bars with diagonal lines). Error bars are given as ± SE of three biological replicates. Production of exclusively the d-lactate stereoisomer was confirmed using an enzyme assay.

