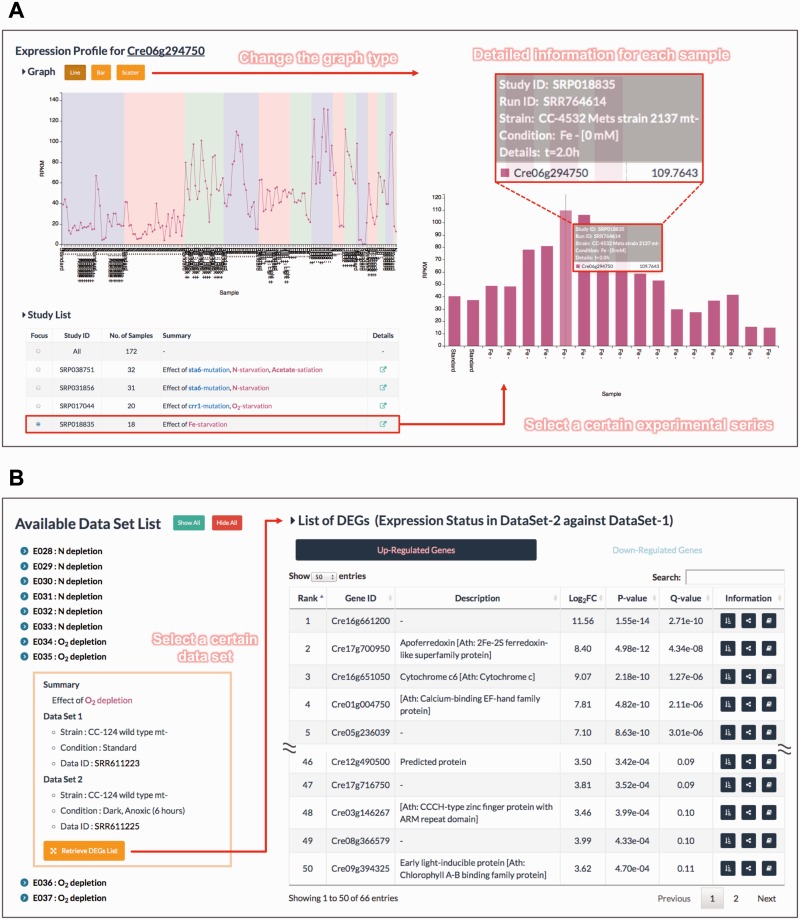
Fig. 2.
The advanced functions of ALCOdb. (A) An example of the ‘Expression Profiler’ tool. Cre06g294750 is used as an example query gene. The line graph shows the overall expression profile and is color-coded as in the experimental series (termed Study). The bar graph shows the detailed expression profile from a study focused on the effects of iron deficiency (SRP018835). When the cursor is moved over a sample in the expression profile, its corresponding detailed information is displayed. The expression level was calculated using the reads per kilobase of exon per million reads (RPKM) metric. (B) An example of the ‘DEG Finder’ tool. The DEGs list shows the highly up-regulated genes under dark and anoxic conditions (SRR611225) relative to standard conditions (SRR611223). The list contains not only the P-values but also Q-values to allow for a flexible definition of DEGs with an arbitrary FDR. In this case, if the top 50 genes in the list are regarded as DEGs (the Q-value of the 50th ranking gene is 0.11), then there will be at least five false positives.

