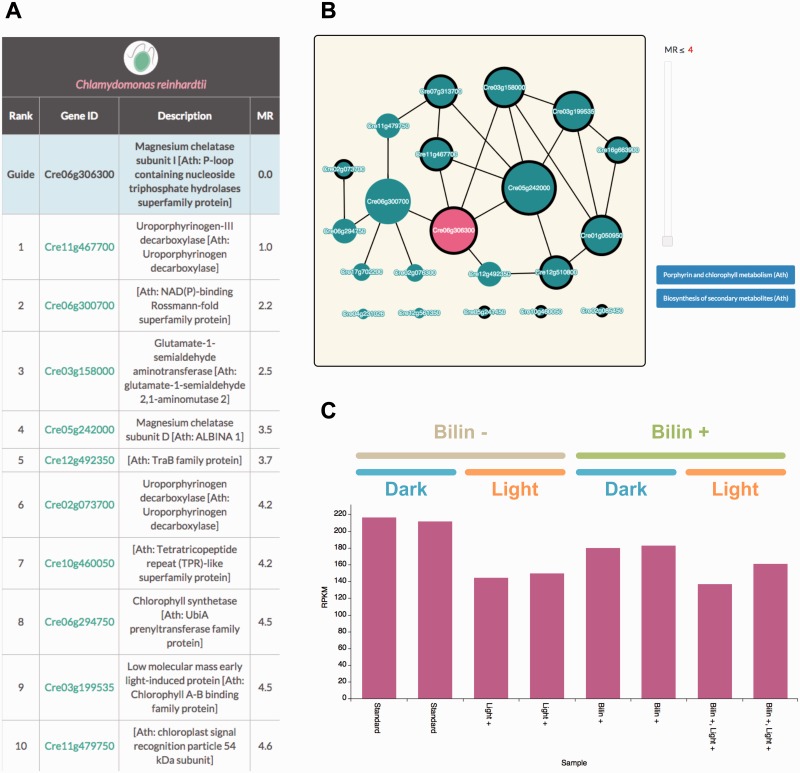
Fig. 3.
An example using ALCOdb to extrapolate the function of a gene. Coexpression analysis for Cre06g306300. (A) The ‘Coexpressed Gene List’ page. Only the top 10 coexpressed genes of C. reinhardtii are displayed. The entire list is available at http://alcodb.jp/coexpression/Cre/Cre06g306300/list. (B) The ‘Coexpressed Gene Network’ page. A set of genes annotated as ‘porphyrin and chlorophyll metabolism’ (KEGG map00860) is enclosed by a thick line. This network graph is available at http://alcodb.jp/coexpression/Cre/Cre06g306300/network. (C) The ‘Expression Profiler’ page with some modifications. The study which focused on the effects of the dark to light transition (SRP014795) is displayed. This expression profile is available at http://alcodb.jp/coexpression/ExpressionProfiler?query=Cre06g306300&target=Cre06g306300.

