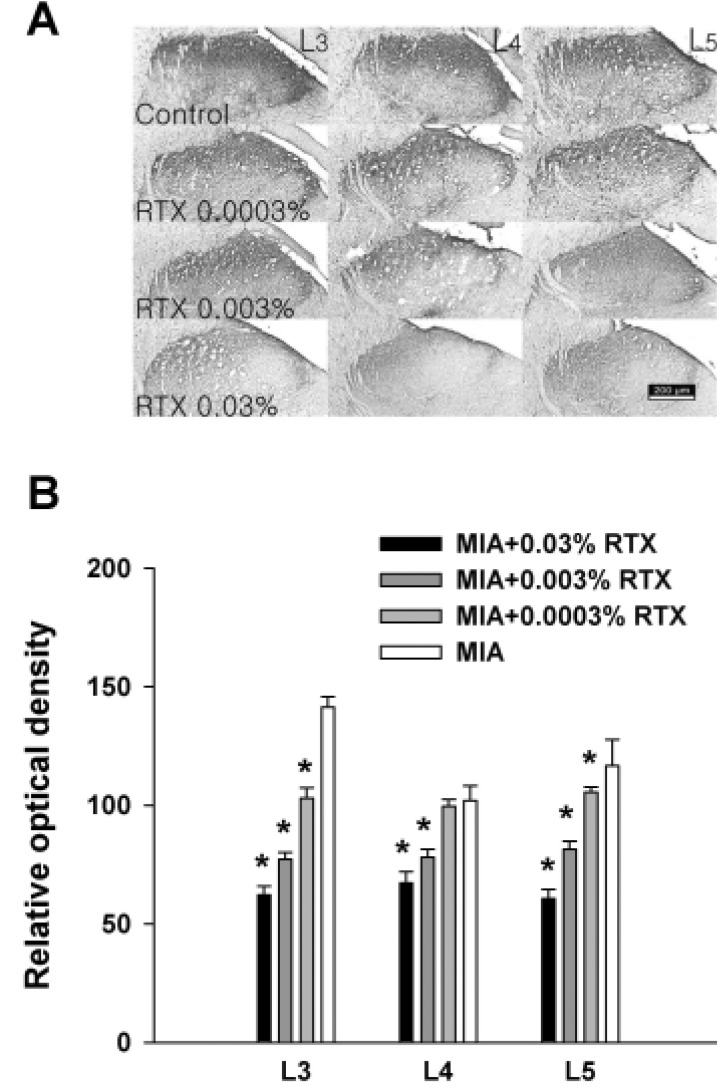
Fig. 3. (A) A representative section showing CGRP immunoreactivity in the dorsal horn of L3, L4 and L5 spinal cord.
Transverse sections of the L3-L5 spinal cord segments were stained with anti-CGRP antibody in each group, scale bar: 200 µm. (B) Relative optical density of CGRP immunoreactivity in each group. Asterisks indicate the values that were significantly different between the RTX treated groups and MIA control group (p<0.05).

