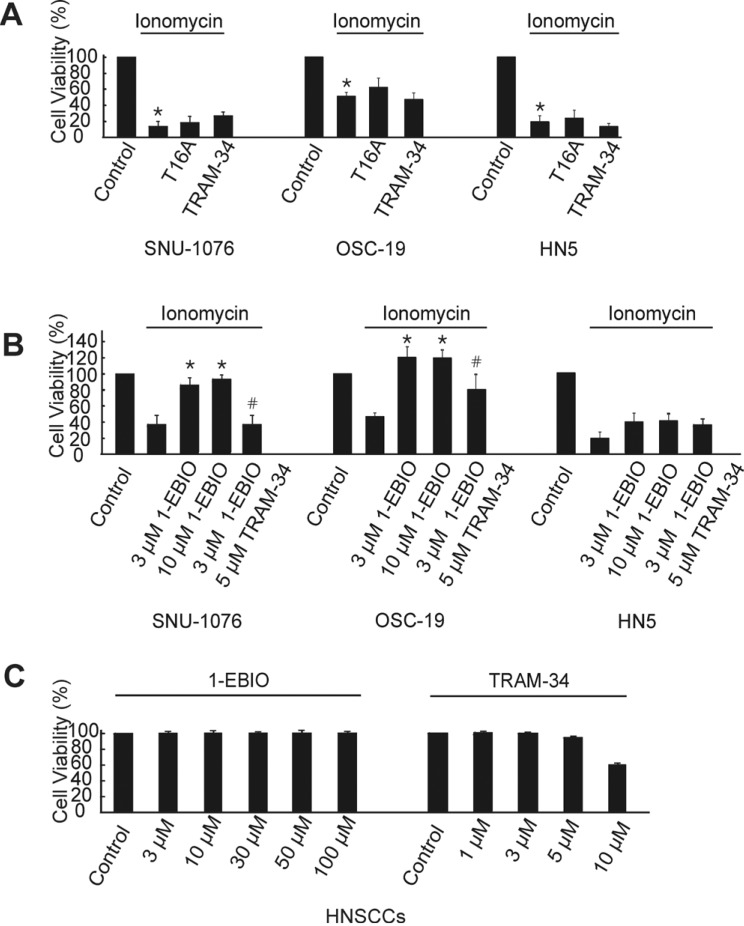
Fig. 3. Ionomycin-induced cell death and rescue effects of 1-EBIO in HNSCCs.
(A) Cells from each cell line were divided into four groups; non-treated (control), treated with 1 µM ionomycin, ionomycin +0.1 µM T16A and ionomycin +10 µM TRAM-34. Cells were subjected to proliferation assay at 48 h and normalized to the control (cell viability). Summary of MTT experiments are displayed. p values were based on comparison with control (*p<0.001). (B) Cells from each cell line were divided into five groups; non-treated (control), treated with 1 µM ionomycin, ionomycin +3 µM 1-EBIO, ionomycin + 10 µM 1-EBIO, and ionomycin/3 µM 1-EBIO +5 µM TRAM-34. Cell numbers at 48 h were counted and normalized to the control (n=6). p values were based on comparison with ionomycin-treated group (*p<0.001) and ionomycin plus 1-EBIO (3 µM)-treated group (#p<0.005). (C) Effects of various concentrations of 1-EBIO or TRAM-34 on the cell viability of SNU-1076 without ionomycin treatment at 48 h.

