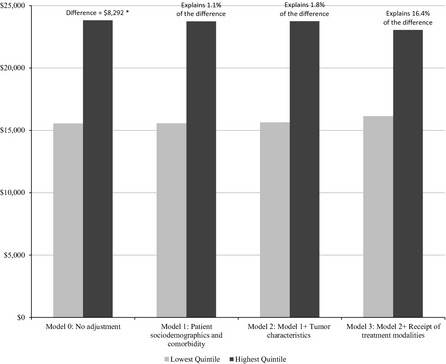
Figure 1.

Variation in Medicare Breast Cancer Expenditures between the Lowest‐ and Highest‐Spending Quintiles of Hospital Referral Regions (HRRs), after Adjustment of Selected Patient, Cancer, and Treatment Factors in Sequential Models
- Note. The percentages reflect the proportion of the initial difference in per patient Medicare expenditure on breast cancer care between the lowest‐ and highest‐spending quintiles explained by each model. *This number differs slightly from the difference in average per patient total breast cancer–related Medicare expenditure between quintile 1 and quintile 5 reported in Table 2. The number in Table 2 (i.e., $8,427) was based on observed expenditures, while the number reported in this figure (i.e., $8,292) was based on a hierarchical generalized linear regression model with no covariates but separate intercepts for cases and controls and HRR random effects for cases and controls to account for clustering in data within HRRs (Model 0).
