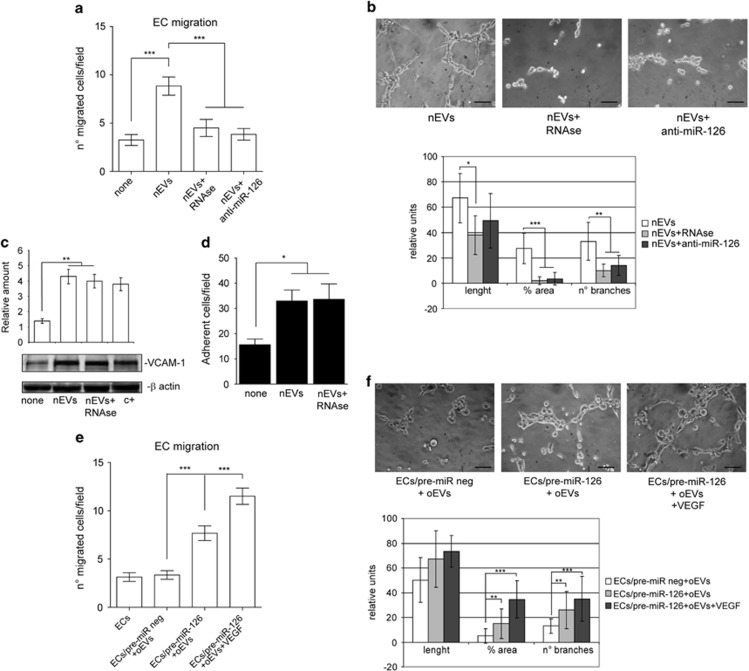
Figure 3.
EV-mediated miR-126 transfer is required for EV functional activities. (a) Migration assays performed on ECs treated with EVs recovered from nASCs that had either been treated with anti-miR-126 antagomir or nEVs+5U RNAse or not at all. The results are representative of five different experiments performed in triplicate (n=5) (***P<0.001 nEVs vs none; nEVs+anti-miR-126 and nEVs+5U RNAse vs nEVs). (b) Representative photomicrographs of in vitro angiogenesis assays, showing tube-like structure formation by ECs treated as above. Quantitative analysis of the number and length of branches and percentage of vessel area (% area) of in vitro formed vessel-like structures is reported as mean±s.e.m. The results are representative of four different experiments performed in triplicate (n=4) (for length, *P<0.05 nEVs+RNAse vs nEVs; for % area, ***P<0.001 nEVs+RNAse and nEVs+anti-miR-126 vs nEVs; for no. of branches, **P<0.01 nEVs+RNAse and nEVs+anti-miR-126 vs nEVs). Scale bars indicate 50 μm. (c) Cell extracts from ECs treated with nEVs or nEVs+5U RNAse were analyzed for vascular cell adhesion molecule-1 (VCAM-1) content and normalized to β-actin content. IL-3-treated ECs were used as a positive control (c+). The results are representative of five different experiments performed in triplicate (n=5) (**P<0.01 nEVs and nEVs+5U RNAse vs none). (d) The adhesion assay was performed by plating red-labeled peripheral blood mononuclear cells on an EC monolayer that had been previously treated, or not, with nEVs or nEVs+5U RNAse. Adherent cells were counted and reported as mean±s.e.m. per field ( × 20 magnification). The results are representative of five different experiments performed in triplicate (n=5) (*P<0.05 nEVs and nEVs+5U RNAse vs none). (e) Migration assays performed on ECs, pretreated with pre-miR-126 precursor or pre-miR-negative control (pre-miR neg) and then stimulated with oEVs. EC migration was also evaluated on cells overexpressing miR-126 in the presence of oEVs and of VEGF (10 ng ml–1). The results are representative of four different experiments performed in triplicate (n=4) (***P<0.001 ECs/pre-miR-126+oEVs and ECs/pre-miR-126+oEVs+VEGF vs ECs/pre-miR neg+oEVs; ***P<0.001 ECs/pre-miR-126+oEVs+VEGF vs ECs/pre-miR-126+oEVs). (f) Representative photomicrographs of in vitro angiogenesis assays performed on ECs treated as indicated in panel (c). Quantitative analysis of the number and length of branches and percentage of area of in vitro formed vessel-like structures is reported as mean±s.e.m. The results are representative of four different experiments performed in triplicate (n=4) (for % area and no. of branches, **P<0.01 ECs/pre-miR-126+oEVs vs ECs/pre-miR neg+oEVs, ***P<0.001 ECs/pre-miR-126+oEVs+VEGF vs ECs/pre-miR neg+oEVs). Scale bars indicate 50 μm.

