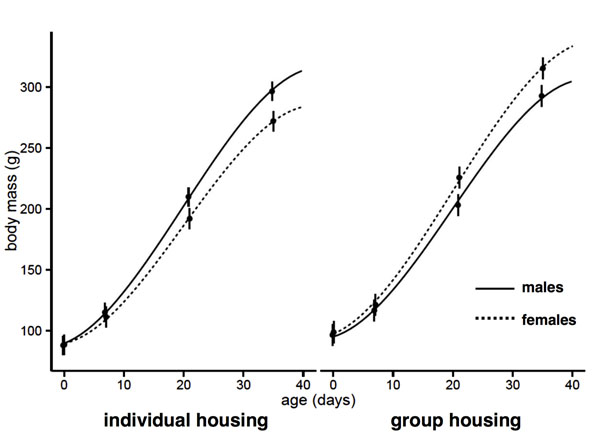
Fig. 1.

Offspring growth. Body mass (means ± SEM estimated separately for each age, with fitted lines from the mixed model) of female (dotted lines, individual: n=18, group: n=17) and male (continuous lines, individual: n=25, group: n=19) offspring of individually housed mothers (left) and group-housed mothers (right). Daughters of individually-housed females had reduced growth and daughters of group-housed females had increased growth (significant three-way interaction between the maternal treatment, offspring sex and age (F1,245=16.15; p=0.0001)
