
Figure 6.
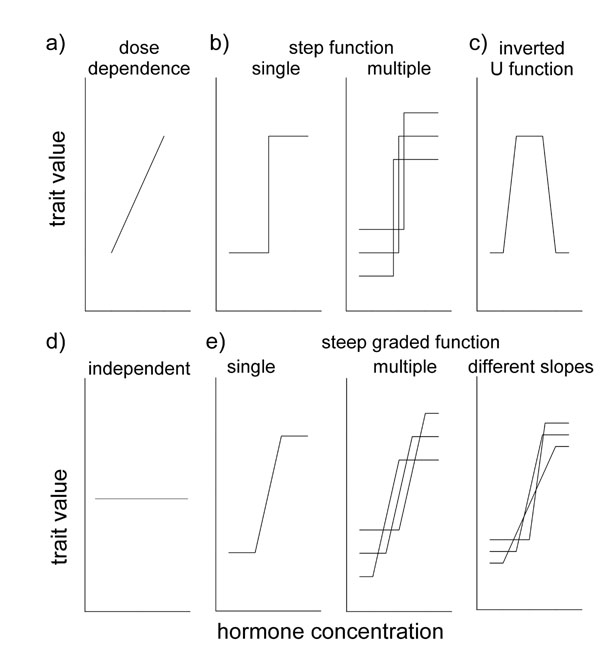
Possible relationships between hormone concentrations and trait expression. A) Dose-dependent relationship between hormone and trait; b) step function (on/off response); c) inverted U function; d) no relationship between hormone and trait; and e) steep graded function, i.e. a dose-dependent relationship within a narrow range of hormone concentration that may differ between individuals (Figure modified from [19,29,126]).