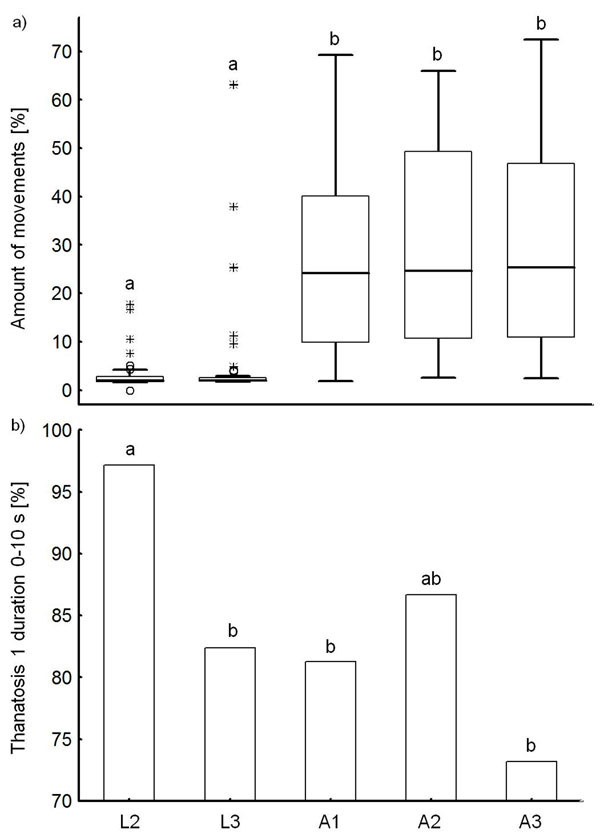
Figure 2.

Changes in a) a typical activity trait (amount of movements) and b) a typical boldness trait (proportion of individuals showing a thanatosis 1 duration of ≤ 10 s) over the lifetime of Phaedon cochleariae (L2, N = 35; L3, N = 51; A1, N = 48; A2, N = 45; A3, N = 41). Lower case letters indicate significant differences (p< 0.05) between the amount of movements (one way repeated measures ANOVA, followed by pairwise multiple comparisons, Holm-Sidak method) and the ratio of individuals with a short thanatosis 1 duration (Fischer's exact tests, comparing data between larval stages and between larval and adult stages; after correction for false discovery rate only the difference between L2 and A3 remained significant). The box plots show the median (line), the 25th and 75th percentiles, outliers (circles), and extreme values (asterisks).
