
FIGURE 4.
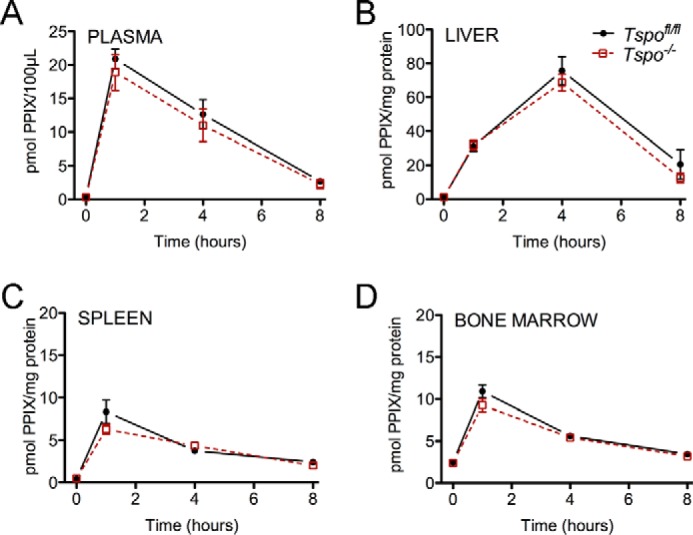
PPIX levels in plasma and tissues from Tspo−/− mice. Panels show normalized PPIX fluorescence in blood plasma (A), liver (B), spleen (C), and bone marrow (D), at baseline and at 1, 4, and 8 h after administration of ALA (n = 6–8/group).
Official websites use .gov
A
.gov website belongs to an official
government organization in the United States.
Secure .gov websites use HTTPS
A lock (
) or https:// means you've safely
connected to the .gov website. Share sensitive
information only on official, secure websites.
PPIX levels in plasma and tissues from Tspo−/− mice. Panels show normalized PPIX fluorescence in blood plasma (A), liver (B), spleen (C), and bone marrow (D), at baseline and at 1, 4, and 8 h after administration of ALA (n = 6–8/group).