
FIGURE 8.
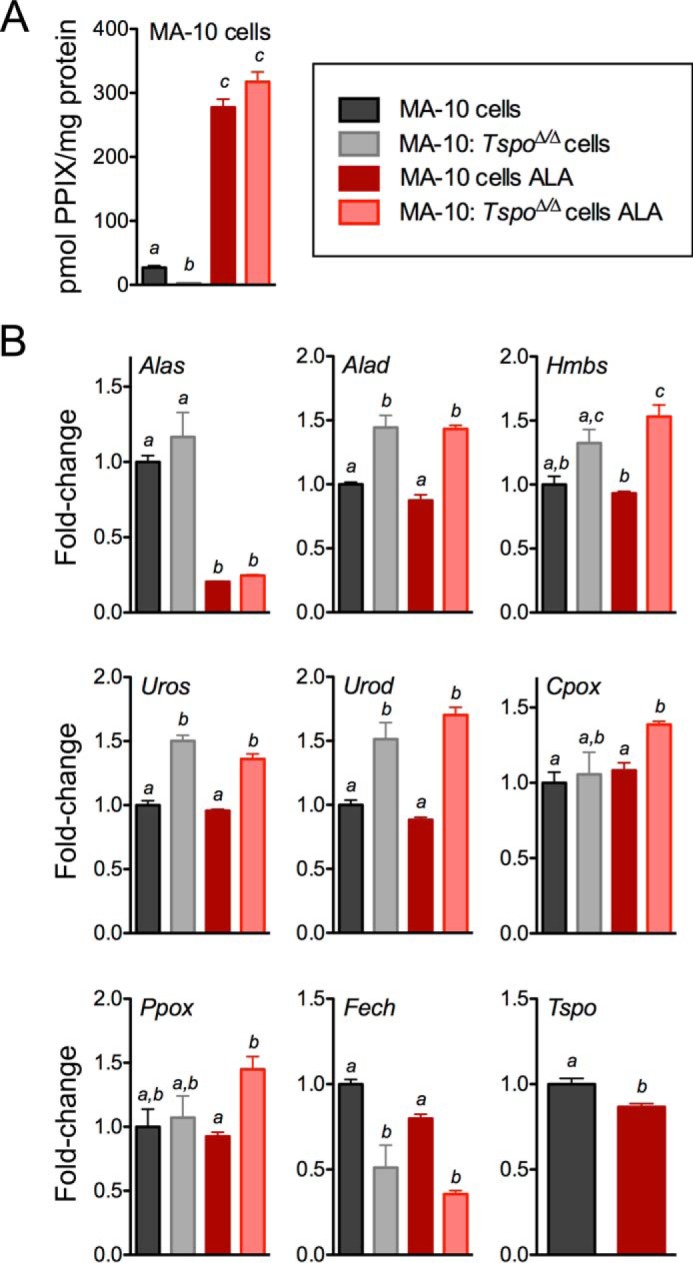
PPIX synthesis from ALA in MA-10 cells and MA-10:TspoΔ/Δ cells. A, PPIX concentration in MA-10 cells and MA-10:TspoΔ/Δ cell lysates before and after treatment with ALA. a, b, and c indicate p < 0.05 (n = 3/group). B, expression levels of transcripts coding enzymes involved in the conversion of ALA to PPIX in MA-10 cells and MA-10:TspoΔ/Δ cells at both baseline and after treatment with ALA. a, b, and c indicate p < 0.05 (n = 3/group).