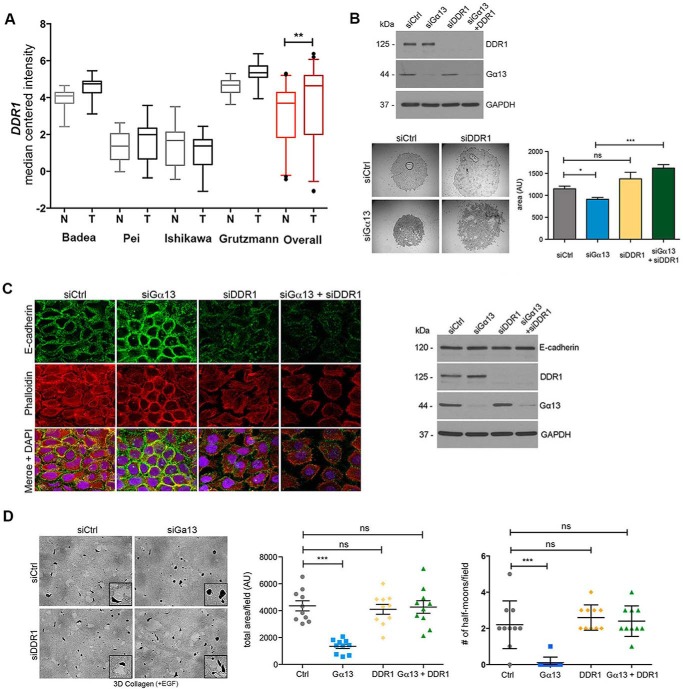
FIGURE 6.
DDR1 knockdown reverses the effect of Gα13 knockdown on cell-cell adhesion and proteolytic invasion. A, the relative expression of DDR1 mRNA was evaluated in human PDAC tumors relative to normal pancreas using the Oncomine database described in Fig. 1A. Overall statistics of Oncomine data were performed using Student's t test. **, p < 0.01. N, normal; T, tumor. B, CD-18-tet-MT cells were transfected with siRNA against Gα13, DDR1, or both Gα13 and DDR1. The effect on DDR1 and Gα13 knockdown was determined by Western blotting. The cells were also plated in suspension in a hanging drop for 18 h in the presence of doxycycline. Quantitation of the area of cell clusters was performed using ImageJ as detailed in Fig. 5. C, CD18-tet-MT cells were plated on glass coverslips, transfected with siRNA against Gα13 and/or DDR1, grown in the presence of doxycycline for 48 h, fixed, permeabilized, and stained for E-cadherin and phalloidin (left panel). CD18-tet-MT cells were transfected with siRNA against Gα13 and/or DDR1 for 48 h, plated in three-dimensional collagen in the presence of doxycycline, and allowed to grow for 48 h. Cell lysates were then analyzed for E-cadherin expression by Western blotting (right panel). D, CD18-tet-MT cells transfected with siRNA against Gα13 and/or DDR1 were grown in three-dimensional collagen in the presence of doxycycline and allowed to invade for 72 h. Quantitation of invasion was analyzed as detailed in Fig. 2A. The number of cell clusters demonstrating a half moon shape was also quantified. The statistics of the invasion assay and the number of half moon cell clusters were performed using one-way ANOVA followed by Dunnett's post-test. The statistics of the hanging drop assay were performed using Student's t test. ns, not significant; *, p < 0.05; ***, p < 0.001. The results are representative of at least three independent experiments. Ctrl, control.

