FIGURE 2.
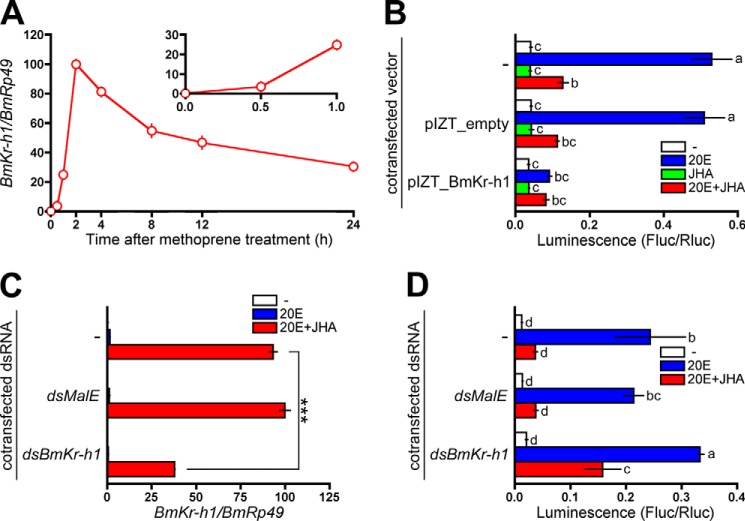
Repression of the BmBR-C promoter by BmKr-h1. A, BM-N cells were treated with 10 μm JHA, and temporal changes in BmKr-h1 expression were monitored by quantitative real-time PCR. B, BM-N cells were cotransfected with a reporter plasmid carrying the −5131 to +52 region (pGL4.14), a reference reporter plasmid, and a BmKr-h1 expression plasmid, and the cells were incubated for 2 days. The transfected cells were treated with 1 μm 20E or 10 μm JHA for 2 days. Reporter activities were measured using a dual-luciferase reporter assay system. C, BM-N cells were transfected with dsBmKr-h1, and the cells were incubated for 2 days. The transfected cells were treated with 1 μm 20E or 10 μm JHA for 2 days, and the RNAi efficiency was monitored by quantitative real-time PCR. D, BM-N cells were cotransfected with a reporter plasmid carrying the −5131 to +52 region (pGL4.14), a reference reporter plasmid, and dsBmKr-h1, and the cells were incubated for 2 days. The transfected cells were treated with 1 μm 20E or 10 μm JHA for 2 days. Reporter activities were measured using a dual-luciferase reporter assay system. Data represent the means ± S.D. (n = 3). B and D, bars with the same letter are not significantly different (Tukey-Kramer test, α = 0.05). C, data were analyzed using Student's t tests (***, p < 0.001).

