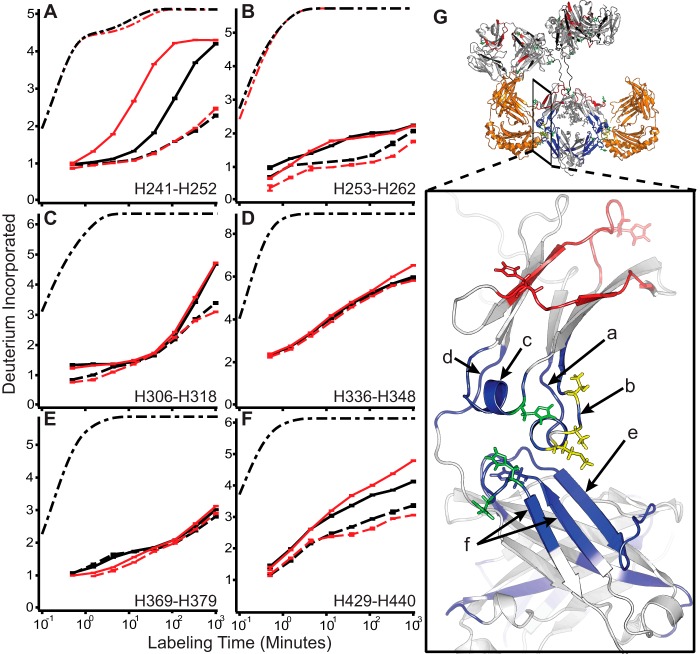
FIGURE 2.
IgG conformational stabilization upon binding FcRn at pH 5.5. A–F, representative uptake traces at pH 5.5 (solid) and pH 5.5+FcRn (dashed) for WT (black) and YTE (red) for all regions whose deuterium uptake profiles change in response to binding FcRn. Dash-dot traces in black (and red where applicable for YTE mutations) represent the theoretical uptake rate, scaled to account for back exchange, for the same amino acid sequence devoid of H-bonds. G, structural locations of peptides are indicated on the zoomed view. Locations of the YTE mutations are shown in yellow; histidines 310, 433, and 435 are shown in green. Peptides stabilized by binding FcRn (orange) are shown in blue along with those regions sensitive to pH and not responding to FcRn in red. Error bars indicate ± S.E. for n = 3.

