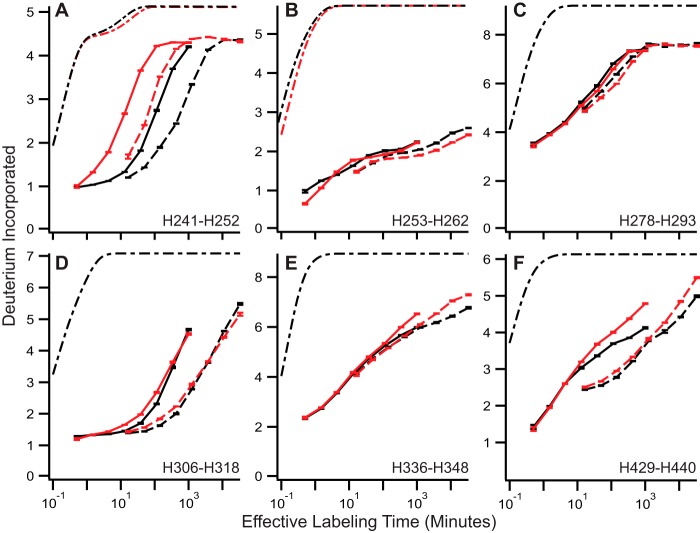
FIGURE 3.
pH reduction destabilizes IgG. A–F, representative HX uptake curves for YTE (red) and WT (black) at pH 5.5 (solid) and pH 7.0 (dashed). Theoretical traces are shown here, as in Fig. 2, in dot-dashed traces. Error bars indicate ± S.E. for n = 3.

