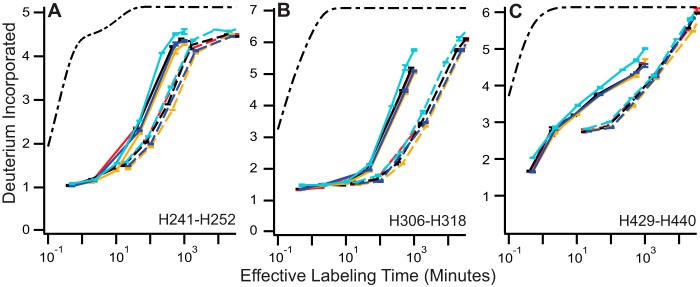
FIGURE 4.
General IgG pH sensitivity observed in other IgG molecules. A–C, HX traces are shown for four additional IgG molecules. pH 5.5 data are shown in solid traces, and pH 7 data are shown in dashed traces; the color of each antibody is maintained for all panels. Error bars indicate ± S.E. for n = 3.

