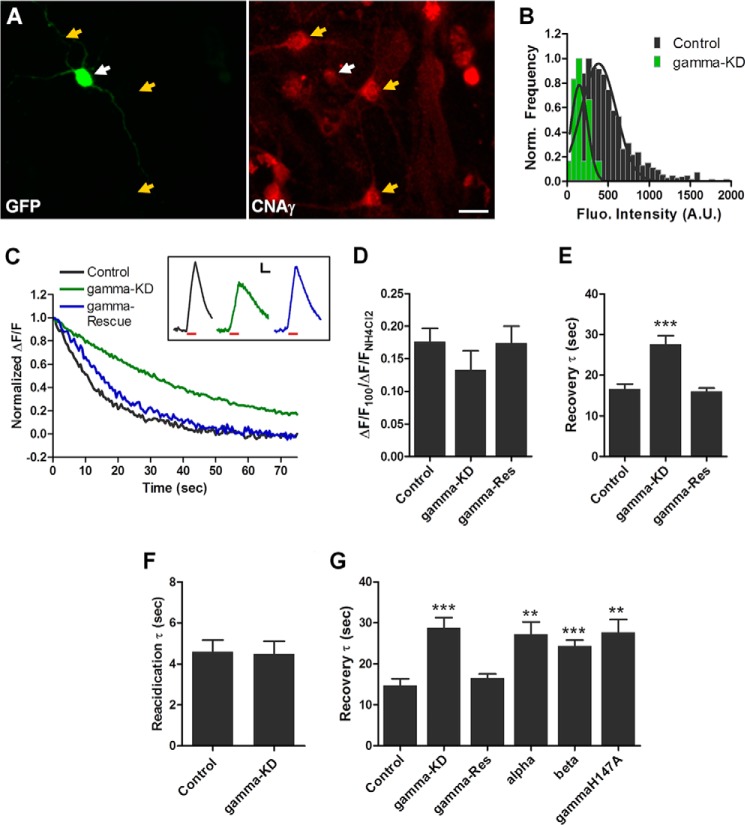
FIGURE 4.
CNAγ knockdown alters synaptic vesicle cycling. A, immunocytochemistry for GFP (left panel) and CNAγ (right panel) performed on primary hippocampal neurons co-transfected with vGlut1-pHluorin and a shRNA targeting CNAγ. White arrows, transfected neurons; yellow arrows, untransfected control neurons. Scale bar = 20 μm. B, normalized histograms of the CNAγ fluorescence (Fluo) intensities from cultured rat hippocampal neurons co-transfected with vGlut1-pHluorin and CNAγ shRNA (gamma-KD, n = 20) or untransfected neurons from the same fields of view (n = 970). C, representative waveform showing the recovery phase of vGlut1-pHluorin fluorescence responses from a control, a CNAγ shRNA-transfected neuron ((gamma-KD), and a CNAγ shRNA- and shRNA-resistant CNAγ co-transfected neuron (gamma-Rescue) in response to a 10-Hz, 10-s stimulation normalized to waveform peaks. Inset, representative non-normalized raw waveforms from neurons as described above. Red line, stimulus period. Scale bars = 0.025 ΔF/F (vertical) and 10 s (horizontal). D, mean ± S.E. peak vGlut1-pHluorin fluorescence intensities in response to a 10-Hz, 10-s stimulation normalized to the peak NH4Cl fluorescence levels from control (n = 8) neurons, CNAγ shRNA-transfected (gamma-KD, n = 6) neurons, and neurons co-transfected with CNAγ shRNA and the shRNA-resistant CNAγ expression vector (gamma-Res, n = 5). E, vGlut1-pHluorin fluorescence recovery time constants (τ) were calculated as described under “Experimental Procedures.” Shown are the mean ± S.E. recovery τ values from waveforms as shown in C from control neurons (n = 11), CNAγ shRNA-transfected neurons (n = 17), and neurons co-transfected with CNAγ shRNA and the shRNA-resistant CNAγ expression vector (gamma-Res, n = 9). F, mean ± S.E. synaptic vesicle reacidification kinetics measured in neurons transfected with either vGlut1-pHluorin alone (control, n = 7) or vGlut1-pHluorin and CNAγ shRNA (gamma-KD, n = 6). G, mean ± S.E. recovery τ values from control neurons (n = 10), CNAγ shRNA-transfected neurons (gamma-KD, n = 9), and neurons co-transfected with CNAγ shRNA and the shRNA-resistant CNAγ expression vector (gamma-Res, n = 10), a CNAα expression vector (alpha, n = 8), a CNAβ expression vector (beta, n = 13), or an inactivated CNAγ expression vector (gammaH147A, n = 6). **, p < 0.01; ***, p < 0.001. Norm., normalized; A.U., arbitrary units.

