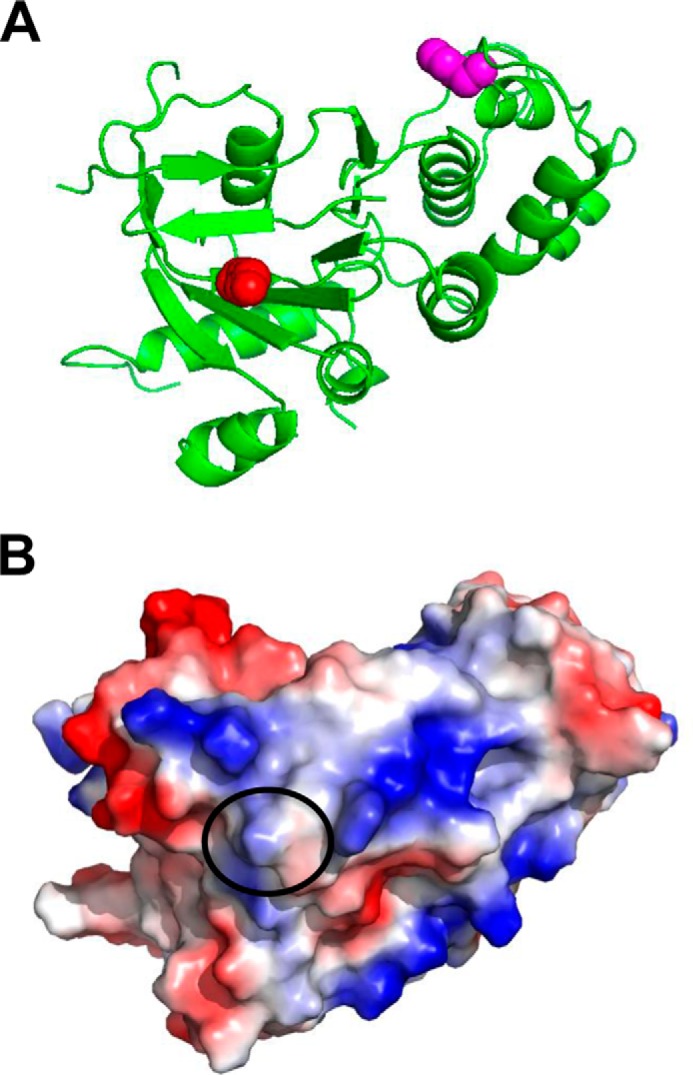
FIGURE 4.

Structural analysis of the location of Lys447 using experimental x-ray structures of NBD1. A and B, the experimentally determined structure of NBD1 is shown as a ribbon (A) or the calculated electrostatic surface (B). The Lys447 residue is shown as a red sphere in the ribbon, and its contribution to the surface on NBD1 is circled in the surface model. The location of the Phe508 residue is shown as magenta spheres for reference in A. The images were rendered using Protein Data Bank code 2BBO for NBD1 (35). As noted in the text, surface exposure of Lys447 is also predicted in the full-length homology model of Serohijos et al. (34).
