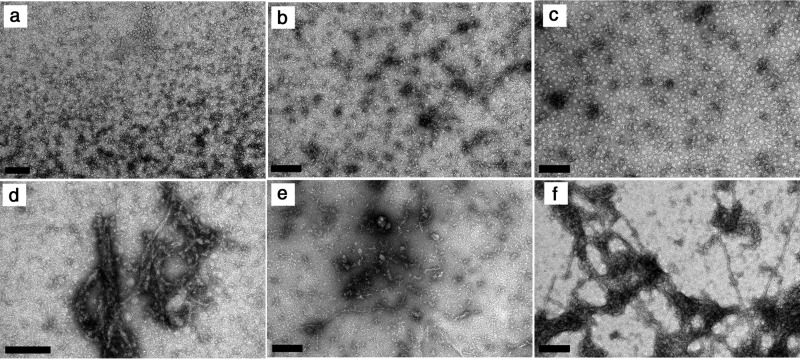
FIGURE 8.
Aggregation of 1.76 mm HEWL at pH 1.6 and 60 °C followed by transmission electron microscopy. a–c, amorphous aggregates identified at the end of 1 (a), 2 (b), and 3 days (c) of incubation; d–f, amorphous aggregates and amyloid fibrils observed at the end of 2 (d), 3 (e), and 4 days (f) of incubation. Scale bars, 200 nm.

