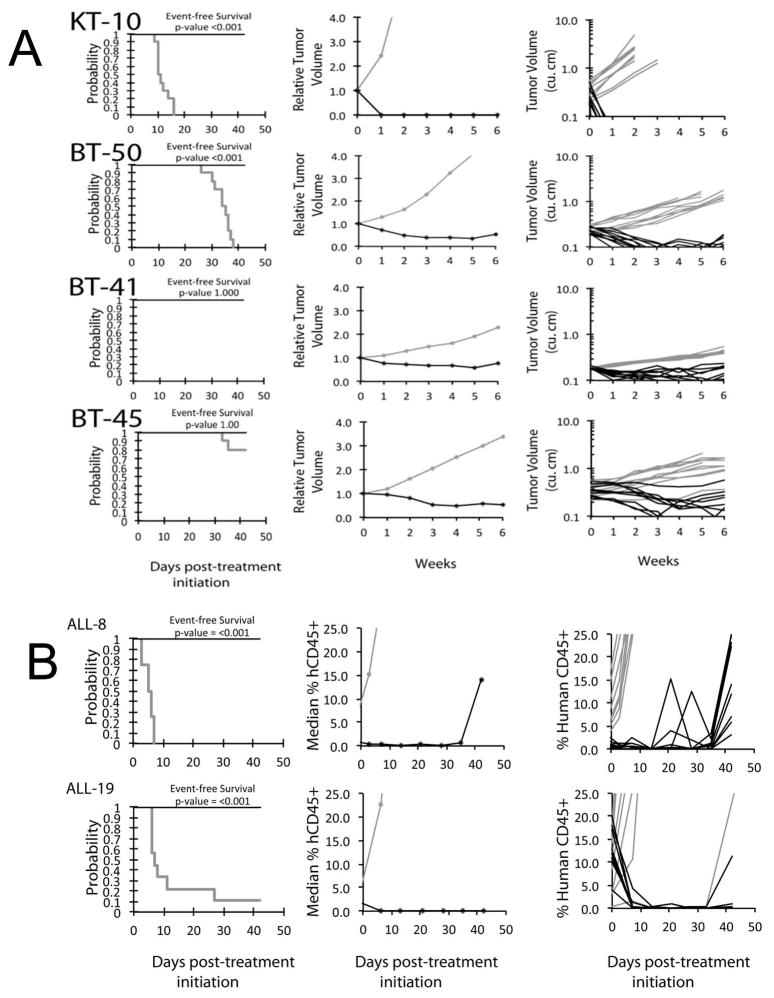
Figure 2.
Selinexor in vivo objective response activity. A solid tumor and brain tumor models. KT-10 (Wilms tumor). BT-50 (medulloblastoma), BT-41 (ependymoma), and BT-45 (medulloblastoma); B ALL models, ALL-8 (T-cell), ALL-19 (B precursor): Kaplan-Meier curves for EFS (left), median relative tumor volume graphs (center), and individual tumor volume graphs (right) are shown. Treated (black lines), statistical significance (p values) of the difference between treated and control groups are included.

