
Fig. 4.
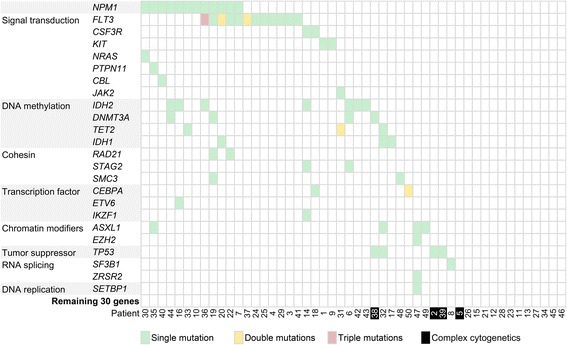
Mutation status matrix across 50 patient samples and 54 genes. Patients (initial samples only, if applicable) and genes are arranged in columns and rows, respectively. Seventy-seven detectable mutations in 24 genes are represented by colored boxes (green, yellow and red for 1, 2, and 3 mutations, respectively). Patient samples with known complex and unfavorable cytogenetics are shaded in black.