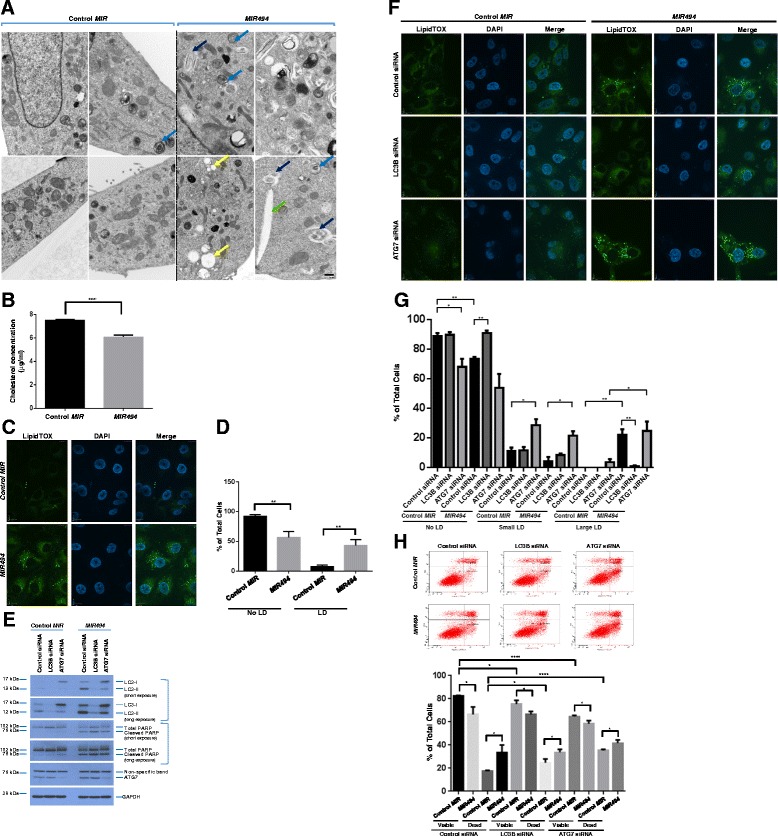
Fig. 4.

MIR494 increases lipid droplets in an LC3B-dependent and ATG7-independent manner. a TEM images captured from MIR494 or control MIR transfected 769-P cells. Yellow arrowheads indicate lipid droplets, green arrowheads indicate cholesterol clefts, blue arrowheads indicate multilamellar bodies, and dark blue arrowheads indicate lipid whorls (autophagosomes). b 769-P cells expressing MIR494 or control MIR were utilized for cholesterol measurements ninety-six hours post-transfection. Three independent experiments were performed. c 769-P cells expressing MIR494 or control MIR were re-seeded at 150,000 cells/well on glass coverslips. Ninety-six hours post-transfection, cells were fixed and stained with green neutral lipid stain. Representative images from three independent experiments are presented. d Graphical quantification of the data obtained from (c). e Protein lysates isolated from 769-P cells treated with LC3B or ATG7 siRNA in the absence or presence of MIR494 or control MIR were analyzed by western blotting using the indicated antibodies. Three independent experiments were performed. f 769-P cells treated with LC3B or ATG7 siRNA were re-seeded at 250,000 cells/well on glass coverslips. Twenty-four hours post re-seeding, MIR494 or control MIR transfection was performed. Seventy-two hours post-transfection, cells were fixed and stained with green neutral lipid stain. Representative images from three independent experiments are presented. g Graphical quantification of the data presented in (f) is shown. h 769-P cells treated with LC3B or ATG7 siRNA in the presence or absence of MIR494 were analyzed by annexin V/PI staining. Raw data plots are shown as log fluorescence values of annexin V-FITC and PI on the X and Y axis, respectively. The percentage of viable and dead cells are shown. Three independent experiments were performed
