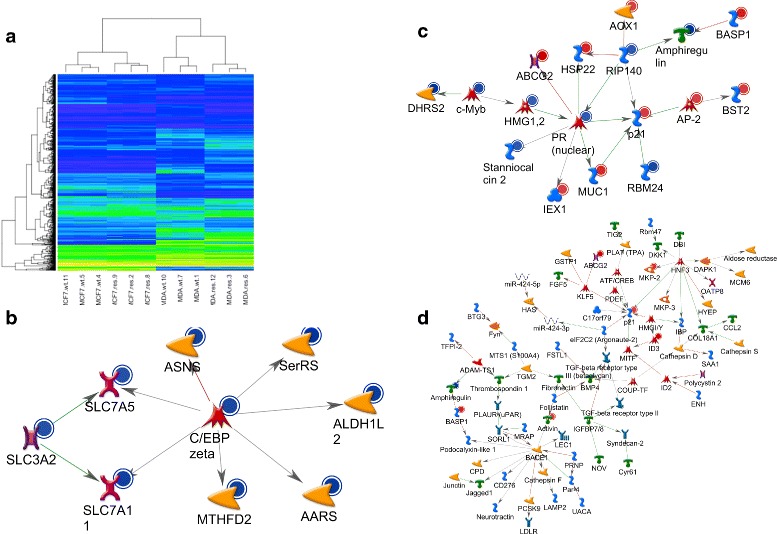
Fig. 2.

Global expression analysis of resistant (res) and non-resistant DMSO control cell lines (wild type, wt). a Heatmap showing differentially expressed genes (see text), the rows are genes, columns samples and the colors show the normalized expression level, yellow being high expression and blue low. b, c, d MetaCore analyses of networks among genes differentially expressed in the resistant cells. In MCF-7acq two networks were identified (b, c) and in the MDAacq a single netwwotk was indetified (d). Network formation was established based on known direct interactions
