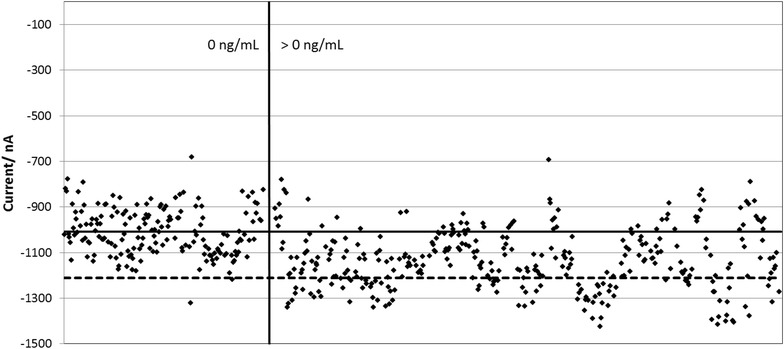
Fig. 10.

Clinical trial results obtained from 4 cannabis smoking donors and 16 non-smoking donors. Each data point is the CA3-CA1 current response for one sensor, using the average chronoamperometric transient current response between 0.05–0.075 s. Each sample was tested with 12 sensors. The solid horizontal line is the average current value of the samples with 0 ng/mL THC. The dotted horizontal line is two standard deviations from the average current of the 0 ng/mL samples. The sensor format and electrochemical sequence were as described in Fig. 8
