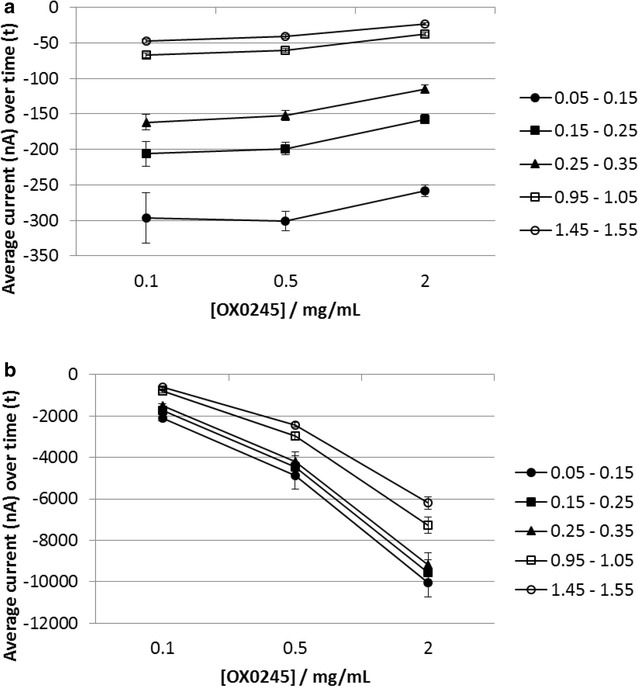
Fig. 6.

Chronoamperometric reduction response to OX0245, using potentiostatic or galvanostatic oxidation. Each data point represents the average current response obtained from 6 sensors, averaged over the time intervals 0.05–0.15, 0.15–0.25, 0.25–0.35, 0.95–1.05 and 1.45–1.55 s. Error bars are one standard deviation. 15 uL of solution containing 0.1, 0.5 or 2 mg/mL OX0245 in 0.04 M AMPSO solution (pH 9.5) 0.1 M NaCl and 0.002 % TX-100 was pipetted onto a sensor. The procedure used a 5 s wait time, then a galvanostatic oxidation at 100 nA for 5 s or b potentiostatic oxidation at +0.3 V for 5 s, followed by chronoamperometric reduction at −0.1 V for 2 s, with a sample rate of 2.5 ms
