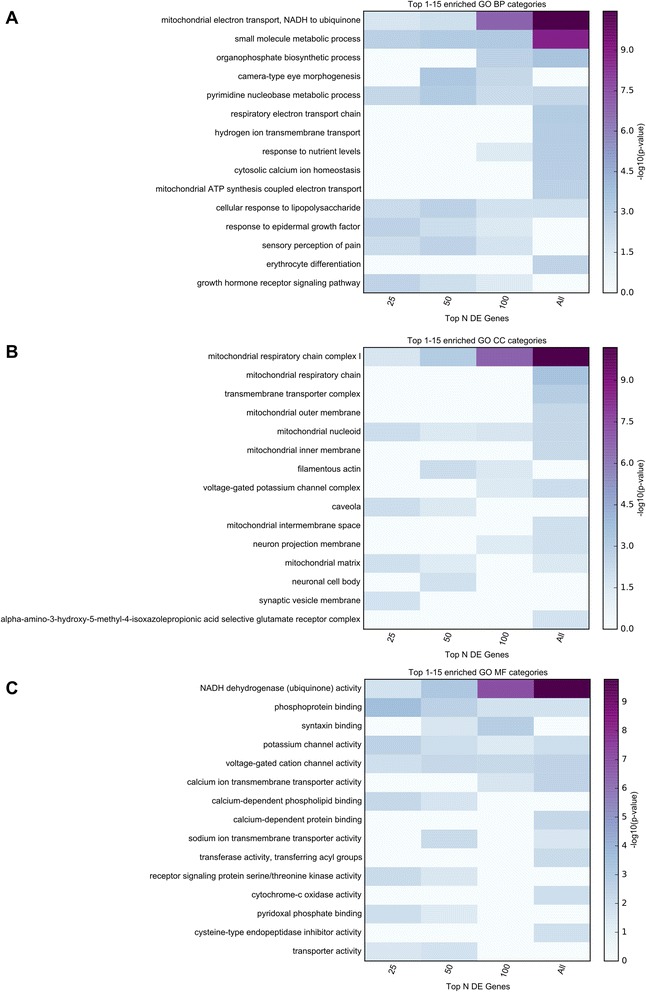
Fig. 3.

TopGO enrichment analysis results for the proteomics study. Functional enrichment analysis was performed for 4 subsets of the significant results obtained in the MS3 proteomics study (top 25, 50, 100, all 283 genes with multiple comparison corrected significance). The top 15 enriched GO terms belonging to GO Biological Processes (BP), GO Cellular Components (CC), and GO Molecular Functions (MF) are displayed in panels a, b, and c, respectively. The presented top results are those with the smallest p-values in any of the subsets of genes used. The top category for each process implicates mitochondrial function as impaired in PD. DE = differentially expressed
