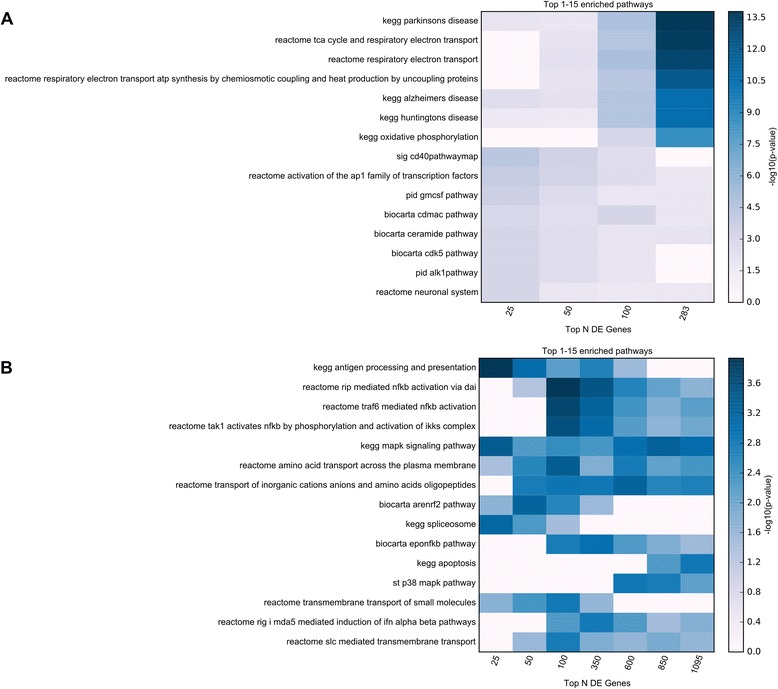
Fig. 4.

MSigDB canonical pathway enrichment analysis results. Functional enrichment analysis was performed for a 4 subsets of the significant genes obtained in the proteomics study (top 25, 50, 100, all 283 genes with multiple comparison corrected significance) and b 7 subsets of the significant genes from the RNA-Seq study (top 25, 50, 100, 350, 600, 850, all 1095 genes with multiple comparison corrected significance). The top 15 enriched MSigDB Canonical Pathways for RNA-Seq and MS3 proteomics results are displayed in panels a and b, respectively. The presented top results are those with the smallest p-values in any of the subsets of genes used. DE = differentially expressed
