
Fig. 2.
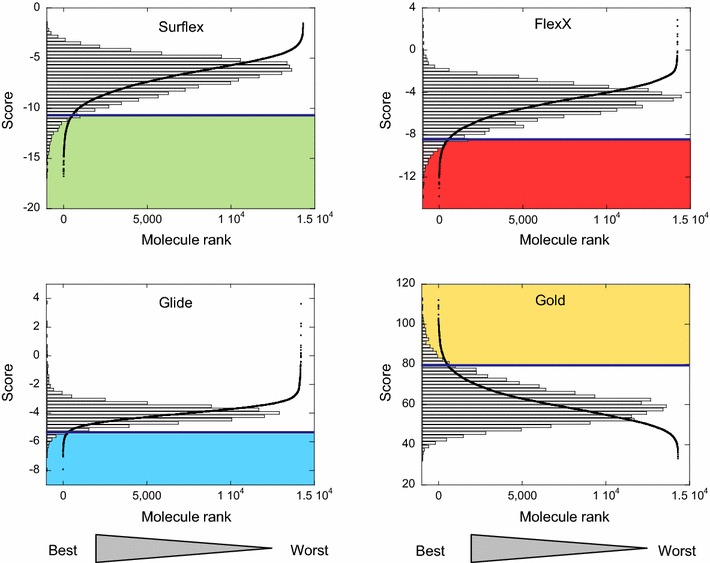
The rank curves of the VS results obtained by the four programs for Cn. In these curves, the score obtained for each compound is reported versus its rank given by the same program. The histogram of the score distribution is superposed to the rank curve. The horizontal line indicates the cutoff of 2× SD that delimits between the stand-out top-ranked molecules (in the colored boxes) and the others