
Fig. 6.
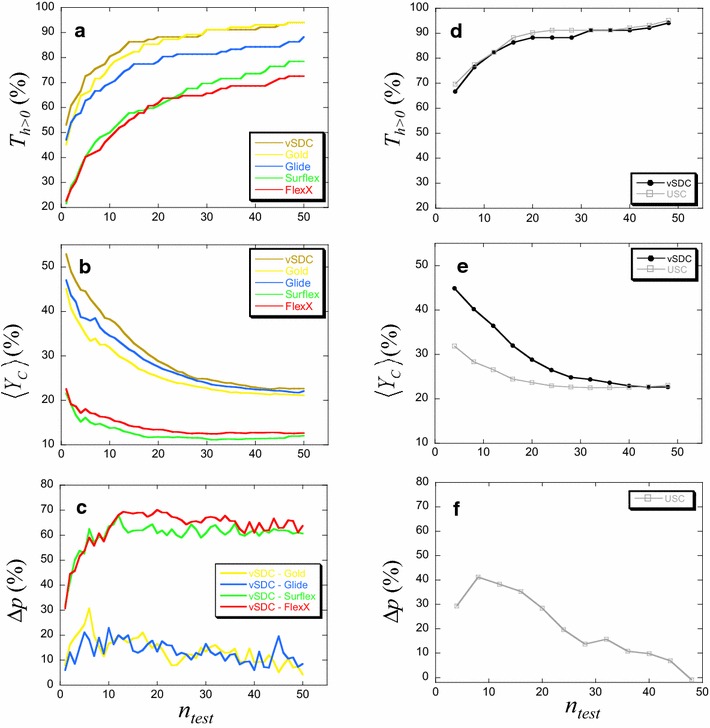
Comparison between vSDC and the isolated programs (a–c) or USC (d–f) for the DUD-E proteins. The comparison is based on the three criteria: a, d the percentage of proteins for which at least one hit was found (, Eq. 1), (b, e) the average corrected yield of actives (, Eq. 4) and (c, f) the percentage of the net balance of proteins (Δp, Eq. 5) for which vSDC is compared to the isolated programs (c) or USC (f). For the latter criterion, if Δp > 0, the result is in favor of vSDC, otherwise (i.e., Δp < 0) it is in favor of the program