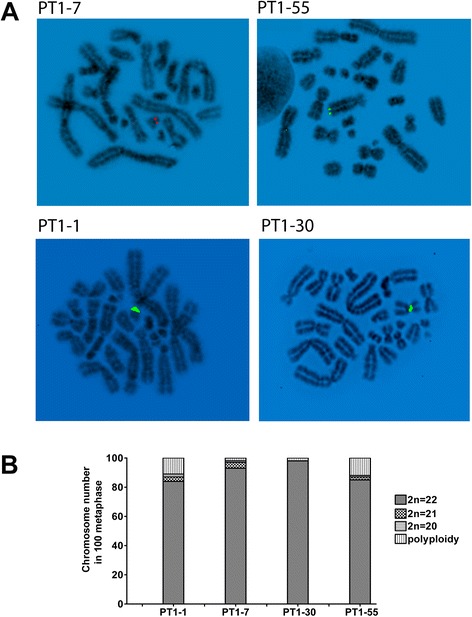
Fig. 1.

Cytogenetic characterization of PT1-CHO cell lines. a FISH analysis showing the different integration sites of the PT1 expression vector in the CHO-K1 genome. A centromeric integration site can be seen for PT1-30, and telomeric for PT1-55. FISH was performed on early passage (P10) recombinant PT1-CHO cell lines. Preparations were counterstained with DAPI (4′,6-Diamidine-2′-phenylindole dihydrochloride). Reverse DAPI conversions were performed to render latent G-banding images visible. Vector DNAs depicted were labelled by nick translation with red emission Dy-590-dUTP (PT1-7), or green emission Dy-495 (PT1-1/30/55) b Chromosome number (i.e. 2n = 22) ranged from 84 to 98 % as determined in 100 metaphases at passage P55.
