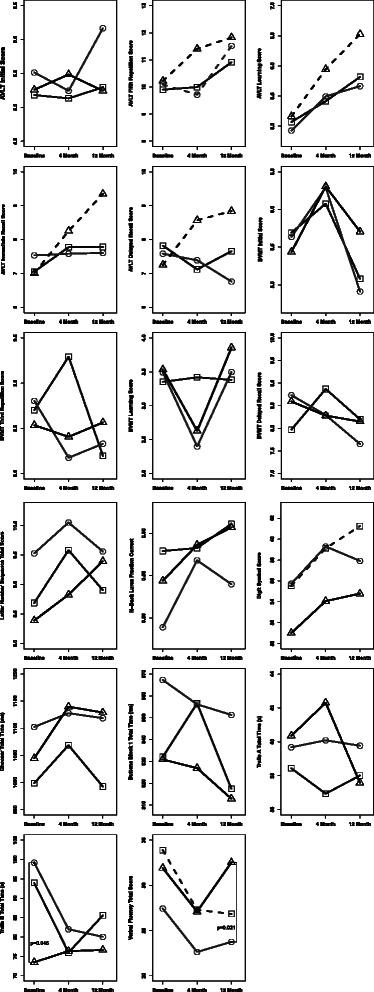
Fig. 2.

Change in selected cognitive tests at 4 and 12 months after switching to frequent nocturnal hemodialysis (circles, ○) receiving a renal transplant (triangles, ∆) or remaining on conventional thrice-weekly hemodialysis (squares, □). Data shows analysis after adjustment for difference in baseline characteristics as described in Additional file 2: Table S1. Refer to Table 1 and legend to Table 4 for a description of the tests and abbreviations. Dashed lines represent statistically significant (p < 0.05) within group changes in test performance between 12 months and baseline. Vertical lines with the associated p-value represent statistically significant (p < 0.05) pairwise differences between study groups at the specified study visit
