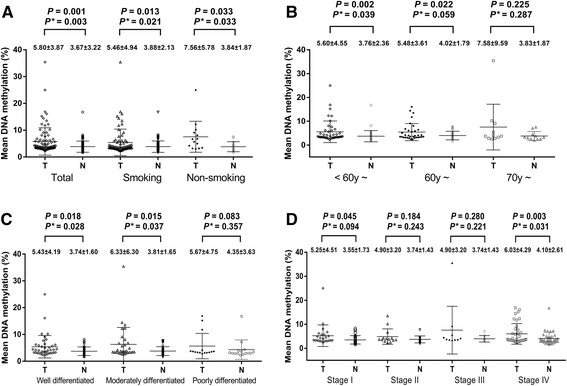
Fig. 3.

Comparisons of mean methylation level of SSTR2 gene between tumor tissues and paired adjacent non-tumor tissues by (a) total and smoking behavior, (b) age, (c) differentiation and (d) clinical stage a. a: T stands for tumor tissues; N stands for non-tumor tissues. P*: adjusted by age, smoking behavior, differentiation and clinical stage
