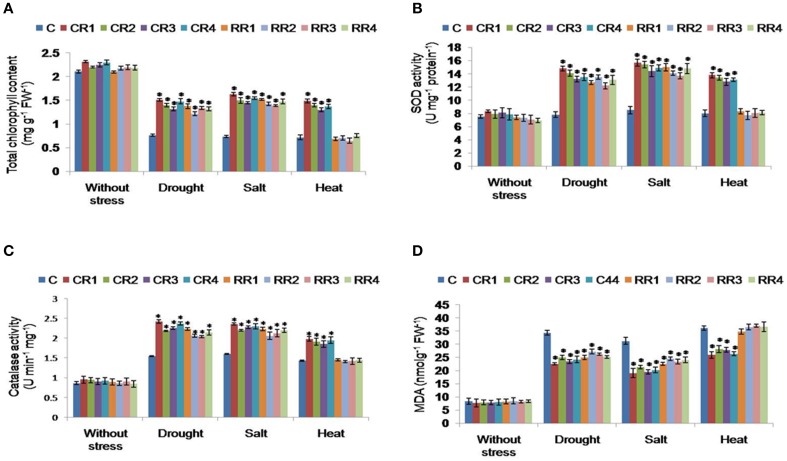
Figure 5.
Biochemical characterization of transgenic plants expressing CcHyPRP gene. Two week old seedlings of control and transgenics were transferred to the Hoagland solution supplemented with mannitol (250 mM) or NaCl (250 mM) for 3 days and heat stress (48°C for 2 h) for estimation of Chlorophyll (A), SOD (B), Catalase (C), and MDA (D). Bar represents mean, and I represents SE from three independent experiments. For each treatment, 10 seedlings were used. *indicates significant differences in comparison with the C at P < 0.05. C represents control plants; CR1, CR2, CR3, and CR4 represent 35S transgenic lines; RR1, RR2, RR3, and RR4 represent rd29A transgenic lines.

