
Fig. 1.
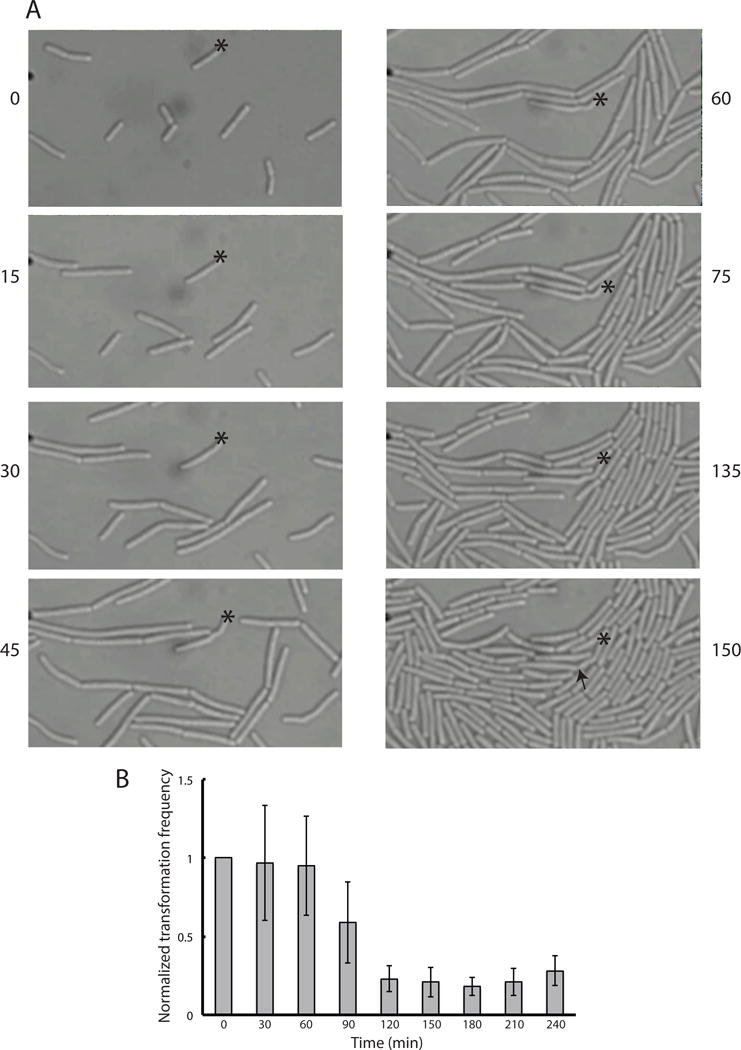
KS cells are delayed in growth. (A) Representative images from a time-lapse microscopy experiment during the reversal of the KS. An asterisk marks a single KS cell of strain BD5810, identified by use of a comG-cfp promoter fusion. The arrow indicates the first detectable indication of cell division. The elapsed time of each frame, in minutes, is given. (B) The transformation frequency to leucine prototrophy of strain BD2899 was measured during emergence from the KS. The values are normalized to the first time point. Error bars represent standard deviations.