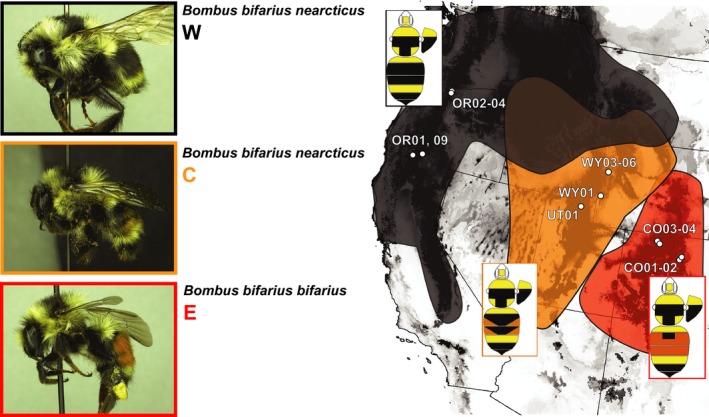
Figure 1.

Geographic distribution of Bombus bifarius in the United States, with sampling sites and general approximation of regions where each color pattern is found (red: B. bifarius bifarius‐E red‐banded, black: B. bifarius nearcticus‐W black‐banded, orange: B. bifarius nearcticus‐C, reflecting regions of intermixed coloration). Boundaries are approximate, as individuals with intermixed pigmentation can be highly variable (Stephen 1957; Lozier et al. 2013; Williams et al. 2014). The underlying gray‐scale range prediction for B. bifarius comes from the ecological niche model of Lozier et al. (2013), where darker shades indicate higher predicted habitat suitability.
