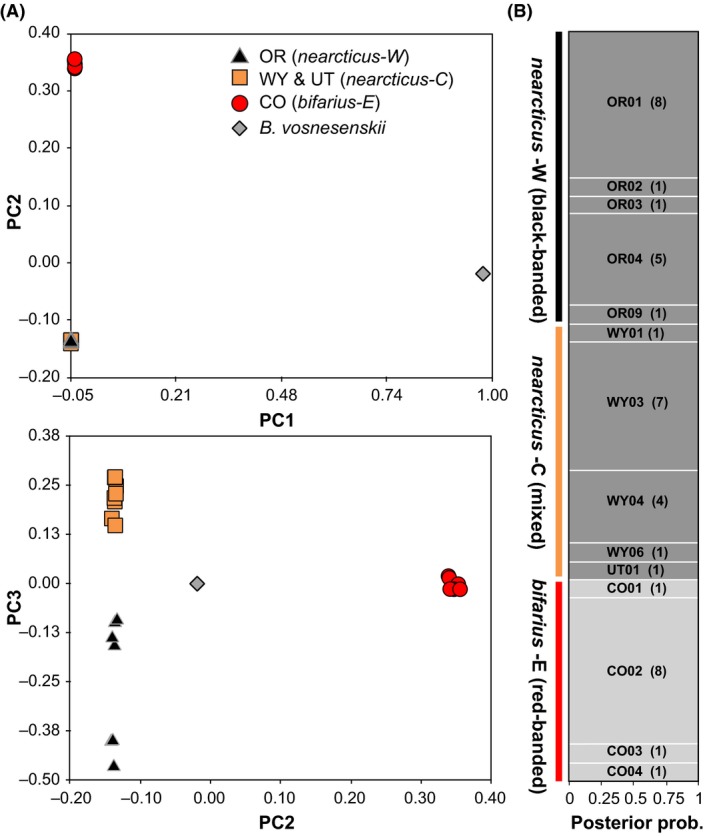
Figure 3.

(A) Principal components axes 1 and 2 (upper) and 2 and 3 (lower) using the full RNA SNP data set filtered for missing data (N = 45,089 SNPs) for B. bifarius and B. vosnesenskii. (B) STRUCTURE results for ddRAD seq data, for K = 2 one SNP per ddRAD locus, no minor allele frequency filter, polymorphic loci only (N = 7248 SNPs). Horizontal bars show posterior assignment probabilities of each individual (vertical axis) to a particular cluster, based on the proportion of the vertical bar that contains each color. Population of origin indicated and collection sites with number of specimens collected in parentheses.
