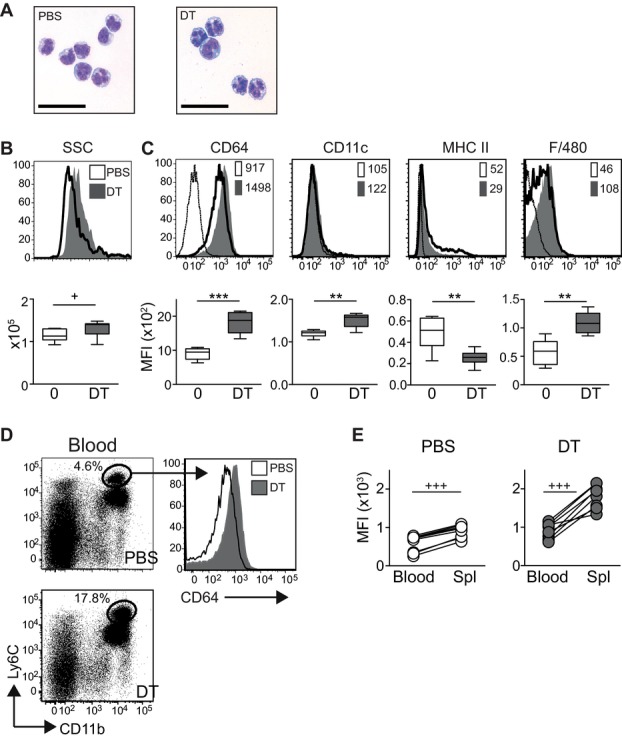
Figure 2.

DT-Ly6C+ monocytes express CD64. (A) Photomicrographs show Giemsa-stained cytospins of sorted CD11b+Ly6ChighCD115high cells from PBS- and DT-treated mice, bars = 100 μM. (B) Representative histograms (top) and graph (bottom) showing SSC of CD11b+Ly6ChighCD115high monocytes from PBS-treated (white) or DT-treated (gray) mice. Graph shows SSC ± SEM from PBS-treated (n = 15) and DT-treated (n = 13) mice. Data are pooled from four independent experiments: PBS versus DT p = 0.0186. (C) Top: representative histograms showing expression of labeled surface markers on CD11b+Ly6Chigh or CD11b+Ly6ChighCD115high monocytes from PBS-treated (white) and DT-treated (gray) mice. Staining with the relevant isotype control is shown by the thin line. Numbers are the median fluorescence intensity (MFI). Bottom: Graphs show the MFI ± SEM for CD64, CD11c, MHC II, and F4/80 on monocytes gated as for the histograms (n = 8 or 6 for F4/80 expression). Horizontal lines mark the mean; data are pooled from three independent experiments: CD64 PBS versus DT p = 0.0002, CD11c p = 0.0014, MHC II p = 0.0070, F4/80 p = 0.0043. (D) Left: representative dot plots showing the frequency of gated live cells in the blood of CD11c.DTR mice injected with DT 48 h earlier. Right: histograms showing expression of CD64 by CD11b+Ly6Chigh monocytes from PBS-treated (white) and DT-treated (gray) mice. (E) Paired line graphs showing the median fluorescent intensity of CD64 on CD11b+Ly6Chigh monocytes from the blood and spleens of PBS- and DT-treated mice. Data are pooled from three independent experiments, n = 8. Student's paired t-test in both PBS- and DT-treated animals, p < 0.0001. Statistical analyses for other experiments were carried out with a Student's unpaired t-test (+) or Mann–Whitney (*) as appropriate.
