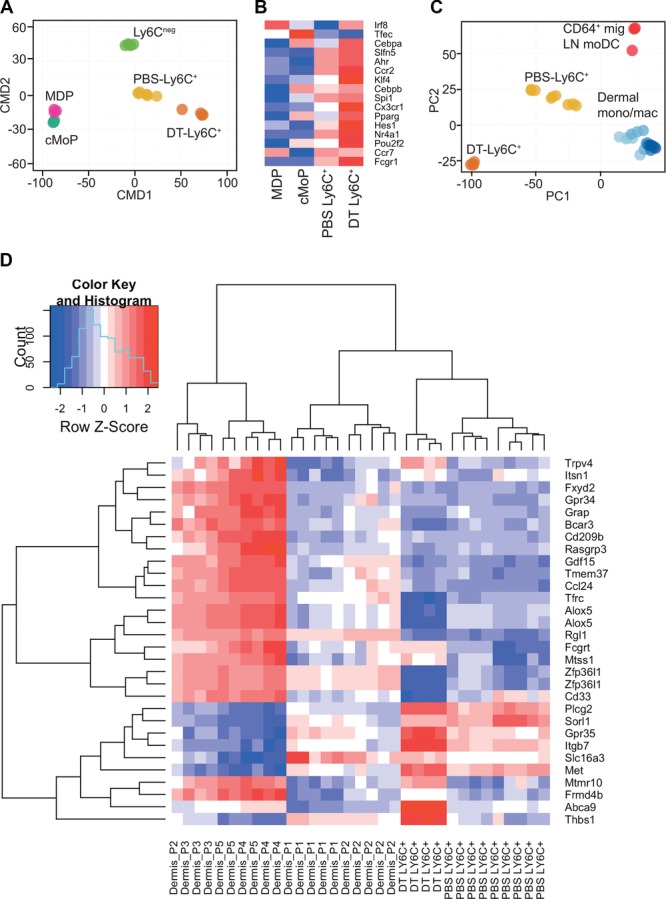
Figure 3.

DT-Ly6C+ monocytes are transcriptionally distinct from blood and tissue monocyte populations. CD11c.DTR mice were injected with PBS or DT, and 48 h later splenic lineagenegCD11b+CD115highLy6Chigh monocytes were sorted to high purity and analyzed by hybridization to an Affymetrix microarray. We also sorted lineagenegCD11b+CD115highLy6Cneg monocytes and BM cMoPs (lineagenegCD117+CD115+CD135negLy6C+CD11bneg) from C57BL/6 mice. (A) Multidimensional Scaling (MDS) comparing the transcriptional profile of DT-Ly6C+ cells to other precursors and monocyte populations (Immgen MDP n = 3, UCL cMoP n = 3, UCL PBS Ly6C+ n = 4, and Immgen (PBS) Ly6C+ n = 3, UCL Ly6Cneg n = 3, and Immgen n = 2). Each subset of cells was purified from at least two independent experiments and was derived from individual mice, or pooled from multiple mice. (B) Heat map comparing the relative expression of a panel of genes associated with monocyte differentiation in the different cell populations. (C) PCA of gene expression by DT- and PBS-Ly6C+ monocytes in comparison to published data for CD64+ migrating LN monocyte-derived DCs and dermal-cell subsets 20. Approximately, 45 and 13% of the variance within the expression data is orthogonal to PC1 and PC2, respectively (58% cumulative). (D) Heat map depicting the relative expression across all samples of the principal gene signature (PC1, Supporting Information Fig. 2D) that separates the dermal P1–P5 group. DT-Ly6C+ n = 4, PBS-Ly6C+ n = 9 (Immgen, UCL), P1–P5 20.
