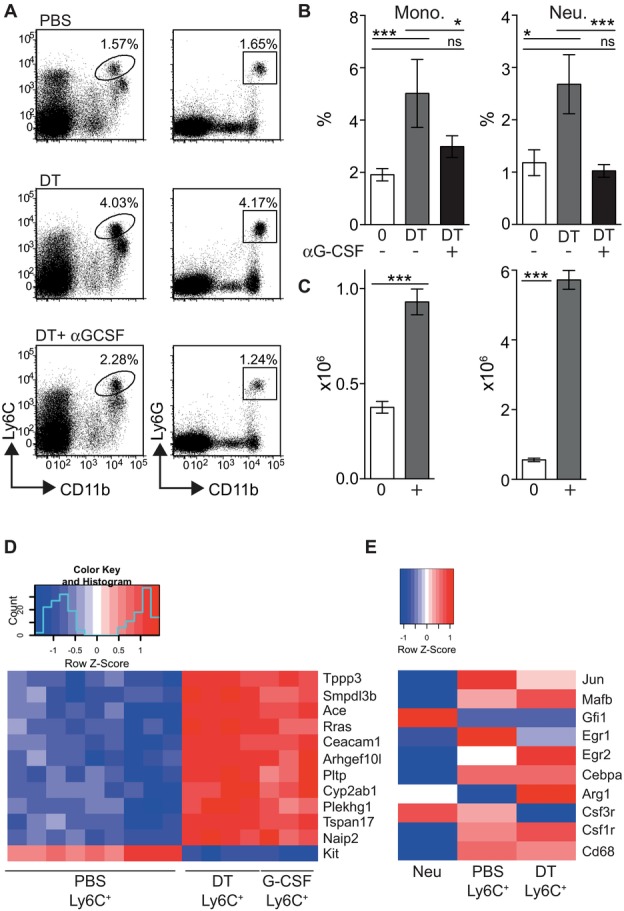
Figure 5.

DC-dependent monocytosis requires G-CSF. (A) CD11c.DTR mice were injected with αG-CSF or control prior to the depletion of DCs and analyzed 48 h later. Representative dot plots showing the frequency of gated monocytes or neutrophils in the spleen. Dot plots are pregated on live single cells. (B) Graphs showing the percentage ± SEM of CD11b+Ly6Chigh monocytes (top) or CD11b+Ly6G+ neutrophils (bottom) in the spleen and blood of PBS-treated (n = 8), DT + control-treated (n = 9), and DT + αG-CSF-treated groups (n = 12). Splenic monocytes PBS versus DT p < 0.001, DT versus DT + αG-CSF p = 0.033, PBS versus DT + αG-CSF p = 0.132; splenic neutrophils PBS versus DT p = 0.028, DT versus DT + αG-CSF p < 0.001, PBS versus DT + αG-CSF p = 0.296; ns = not significant. Data are pooled from three independent experiments. (C) WT mice were injected s.c. with PBS (0) or G-CSF (+) for 5 days. Graphs show the number ± SEM of CD11b+Ly6C+ monocytes (left) and CD11b+Ly6G+ neutrophils (right) in the spleens of treated or control mice. Cells were gated from plots equivalent to those shown in Figure 1A. Monocytes and neutrophils PBS versus G-CSF p < 0.0001. Statistical analyses were carried out with a Mann–Whitney U test. (D) Splenic lineagenegCD11b+Ly6C+ monocytes were purified from mice treated with G-CSF (G-CSF-Ly6C+ cells). A representative panel of the 12 most significant expression differences between PBS Ly6C+ and DT Ly6C+ monocytes was elected using the limma procedure. The heat map shows that the G-CSF Ly6C+ samples show a strongly similar expression pattern to DT Ly6C+ according to these genes: PBS-Ly6C+ n = 9, DT-Ly6C+ n = 4, G-CSF-Ly6C+ n = 3. (E) Heat map showing differential Z-scored expression of a neutrophil/monocyte gene panel in the three sets of samples: Neu (n = 4), PBS Ly6C+ (n = 9), and DT Ly6C+ (n = 4). The gene expression profile for neutrophils was obtained from the Immgen database.
