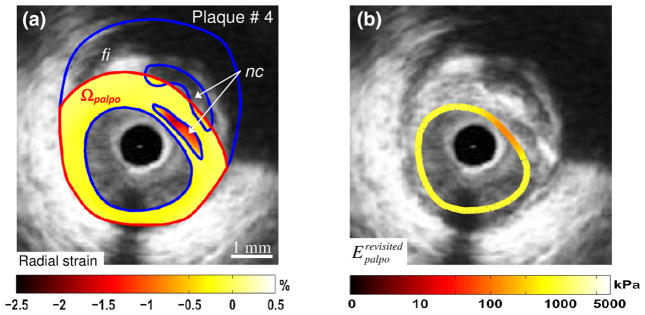
FIGURE 5.
Performance of the improved E-PT of Deleaval et al.19 to detect a complex vulnerable plaque with two necrotic cores. (a) IVUS image of plaque # 4 with plaque constituents (blue contours, “nc”: necrotic core; “fi”: fibrous region). The external boundary of the palpography domain Ωpalpo is given (red contours). The measured radial strain-elastogram in the palpography domain Ωpalpo is also presented. (b) Computed improved S–SM palpogram. The color coded strip superimposed on the IVUS image gives at each circumferential point the computed modulus over the corresponding radial thickness of the plaque. This result illustrates the abilities of the proposed technique to detect the soft inclusions located between 1 and 3 o’clock.

